Prerequisites
If you already monitor PostgreSQL with the plug-in, most of this list is in place today. What the plug-in needs falls into three groups. A monitoring role that can read PostgreSQL’s statistics catalogs covers all existing monitoring. Plan capture and the advisors built on it need auto_explain plus one privilege grant. The third group is a short list of optional extensions that add What-If index simulation, predicate-based index advice, wait-event sampling, and table bloat estimates. The plug-in applies none of it for you except the auto_explain settings, and only when you click Configure auto_explain.
Where to find it: every item below is checked live, per target, on the database target’s Monitoring Readiness page.
In this page: Supported versions and platforms · Enterprise Manager and agents · Network and connectivity · The monitoring role · Statement statistics (pg_stat_statements) · Plan capture (auto_explain) · The server log read grant · Optional extensions · Preferred Credentials · Agent host · Prerequisites checklist
Supported versions and platforms
| Component | Supported Versions / Platforms |
|---|---|
| Oracle Enterprise Manager | Cloud Control 13c (13.5.0.0.0+), 24ai (24.1.0.0.0+) |
| PostgreSQL | Versions 14-18 |
| OMA Operating Systems | Microsoft Windows (64-bit), Linux (64-bit) |
| OMS Operating Systems | All Oracle supported OMS platforms |
| PostgreSQL Database OS | All PostgreSQL supported (for remote monitoring) |
Enterprise Manager and agents
This release ships as two plug-in builds with the same features: 24.1.3.0.0 for Enterprise Manager 24ai and 13.5.17.0.0 for Enterprise Manager 13.5. The version number tells you which Enterprise Manager the build is for, not what it does; everything in this guide applies to both.
Before you add any target, import the plug-in OPAR, deploy it to the OMS, then deploy it to each agent that will monitor a PostgreSQL instance. See Install and upgrade.
A valid license key is required to monitor a target; it is a target property. See License key.
Network and connectivity
The agent connects to PostgreSQL over JDBC on the database port, 5432 by default. Open that path from the agent host to every instance you monitor, including any replicas you plan to add as targets.
- Create a PostgreSQL role for monitoring, with access to each database you want monitored.
- Allow that role to connect from the agent host: add a matching entry to
pg_hba.conf, and make surelisten_addressesaccepts connections from that address. See pg_hba.conf in the PostgreSQL documentation. - Reload the server so the new authentication rule takes effect.
Every read against the monitored PostgreSQL instance travels over this one connection, including reading the server log for captured plans. The plug-in needs no OS-level access to the database host, so a remote agent collects the same metric data as a local agent, apart from three local-only capabilities: the Logs page, the Kill Idle PostgreSQL Connections job, and the collection throttle.
Cluster targets using the Patroni REST API also need a path to the Patroni API port. See Patroni REST API monitoring.
The monitoring role
The monitoring role reads catalogs and statistics views. It never writes to your data, and the plug-in never grants privileges to itself or to anyone else.
These are the objects the plug-in reads: pg_stat_* (including pg_stat_activity, pg_stat_progress_vacuum, and pg_stat_statements), pg_class, pg_index, pg_settings, pg_replication_slots, and pg_prepared_xacts.
Grant the monitoring role membership in pg_monitor (or equivalent read access to the statistics catalogs):
GRANT pg_monitor TO "<monitoring role>";
pg_monitor already carries pg_stat_scan_tables, which is what pgstattuple’s approximate function needs for the table bloat estimates on Vacuum Advisor, so no additional grant is needed for the estimate. A table the role somehow cannot read is skipped and logged; the collection does not fail.
One capability needs more than pg_monitor: plan capture needs EXECUTE on the server-log functions so the plug-in can read the server log. See The server log read grant.
Statement statistics (pg_stat_statements)
pg_stat_statements is required for SQL statement monitoring and for Workload History. Without it, statement-level pages stay empty.
- Add
pg_stat_statementstoshared_preload_librariesinpostgresql.confand restart the server. - Run
CREATE EXTENSION pg_stat_statements;in each database you monitor. Extensions in PostgreSQL are per-database. - Confirm the
pg_stat_statementsview is available in the primary database you monitor.
See pg_stat_statements in the PostgreSQL documentation. Preloading the extension also lets compute_query_id = auto produce real query ids, which matters for plan capture.
track_activities and track_counts must be on. Both are on by default in PostgreSQL.
The Monitoring Readiness page reports this extension under its “Statement Monitoring & Workload History” panel.
Plan capture (auto_explain)
Execution plans are captured passively: auto_explain writes each qualifying statement’s plan into the server log while the query runs, and the plug-in harvests those plan bodies over its existing JDBC connection. There is no re-execution and no plug-in-initiated EXPLAIN.
auto_explain ships with PostgreSQL’s contrib modules. Install that package on the database server; the plug-in configures the module but does not install it.
| Setting | Required value | Why | Who sets it |
|---|---|---|---|
session_preload_libraries |
includes auto_explain |
Loads the module for new sessions. No server restart. | Plug-in (Configure auto_explain) |
auto_explain.log_min_duration |
0 or higher, in milliseconds |
The capture threshold: only statements running longer than this are captured. -1 disables capture. The Configure preview prefills the current server value, or 1000 ms when it is unset. |
Plug-in (Configure auto_explain) |
auto_explain.log_format |
json |
The harvester parses JSON plan bodies. | Plug-in (Configure auto_explain) |
auto_explain.log_analyze |
on |
A hard capture prerequisite: captured plans need actual rows and timings for drift and insight detection. It adds per-query instrumentation cost, so enabling it is the per-target opt-in. Applied together with auto_explain.log_timing = on. |
Plug-in (Configure auto_explain) |
auto_explain.log_verbose |
on, recommended |
Carries the real query id into the captured plan. Without it the plug-in falls back to synthetic ids shown as syn:…, derived from the query text. Grouping and drift pairing still work, but the ids will not match pg_stat_statements. |
Plug-in (Configure auto_explain) |
compute_query_id |
on, or auto with pg_stat_statements preloaded. Recommended |
Pairs with log_verbose so every captured plan carries its real query id. |
Plug-in (Configure auto_explain) |
logging_collector |
on |
A current server logfile has to exist for the plug-in to read. | DBA |
log_destination |
stderr |
The harvester parses stderr-format logs. csvlog and jsonlog are not parsed. |
DBA |
log_line_prefix |
begins with %m |
Plan lines are matched by their leading timestamp. | DBA |
Apply the plug-in-settable rows from the Plan Capture (auto_explain) panel on Monitoring Readiness: click Configure auto_explain, review the preview, then click Apply. See Configure auto_explain.
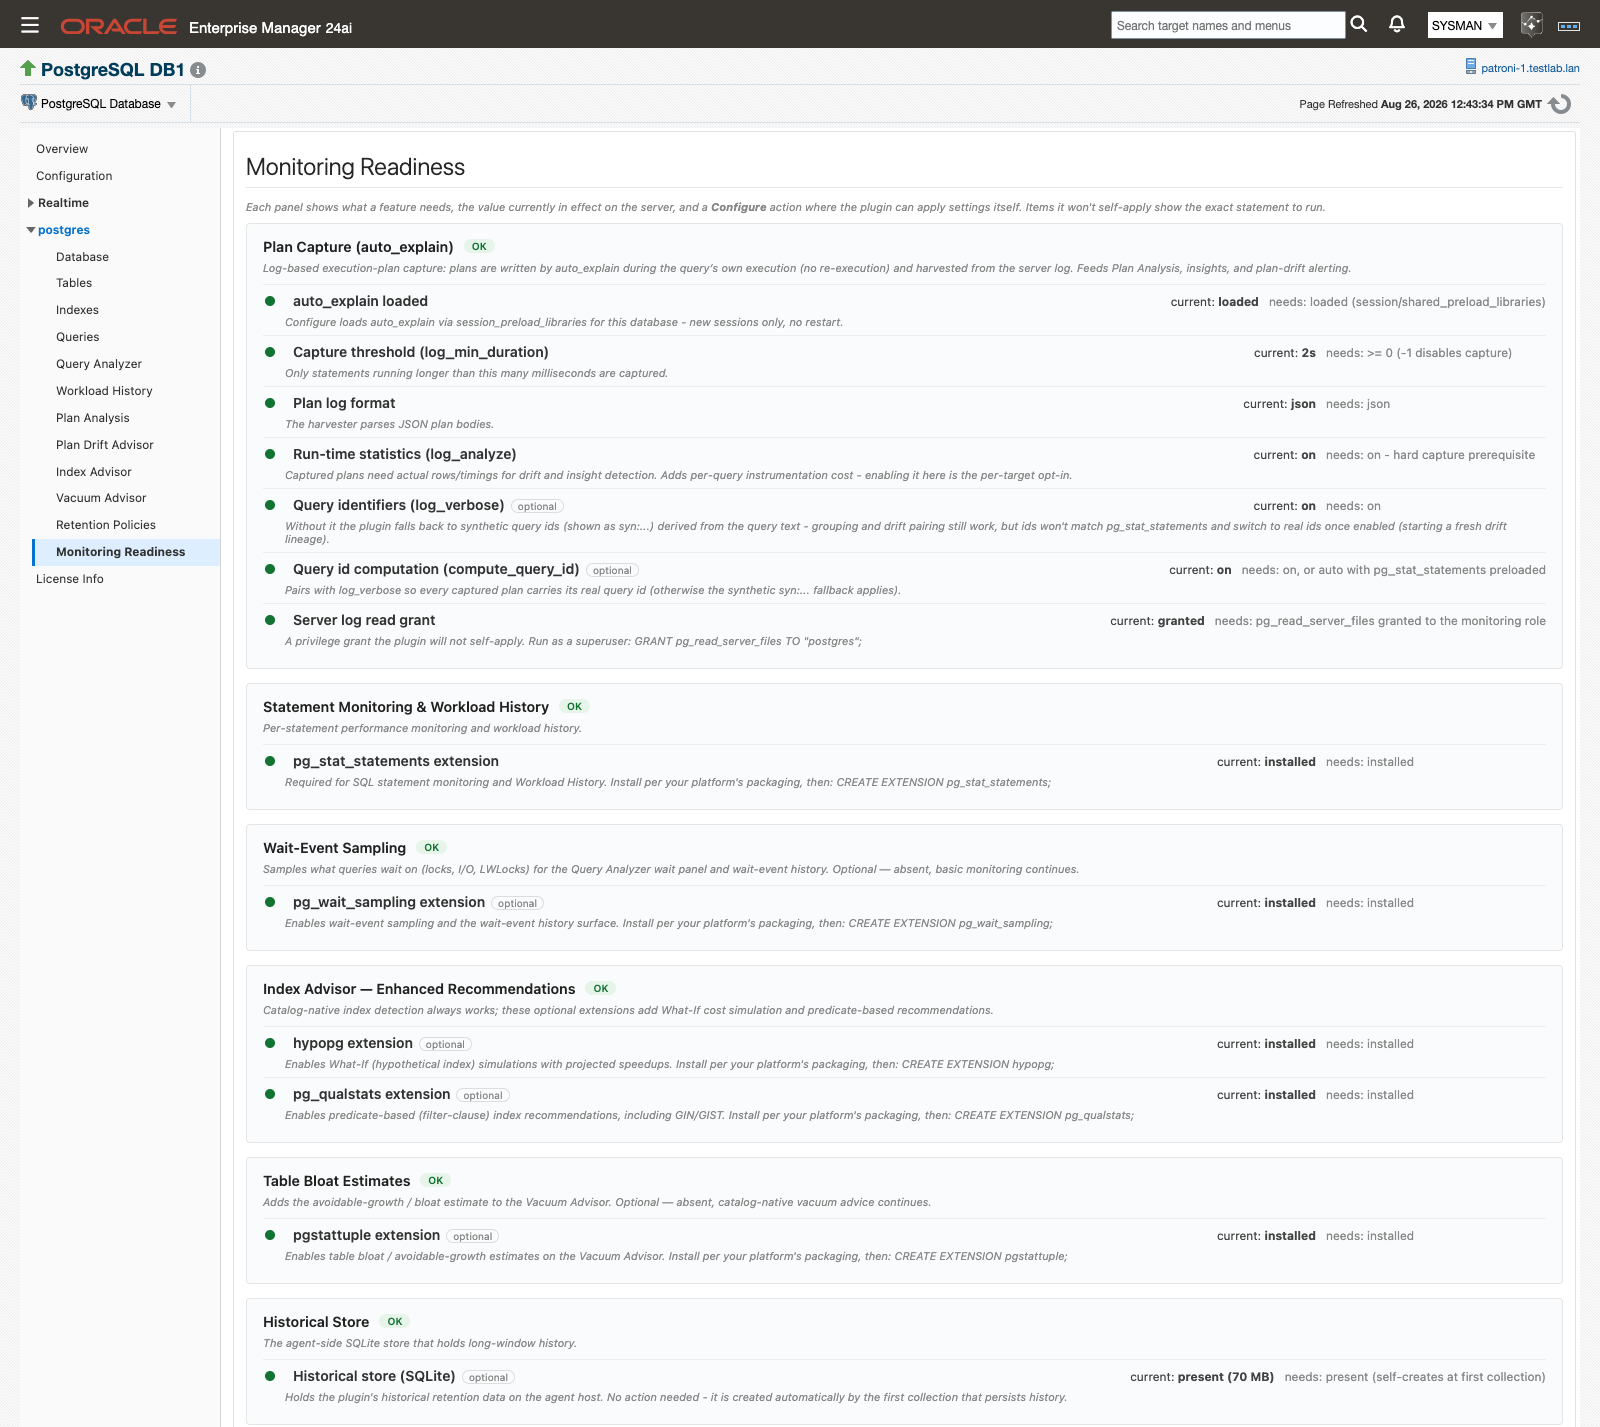 Monitoring Readiness reports every prerequisite on this page against the values in effect on the server.
Applied settings take effect for new sessions only, so long-lived application sessions keep their old settings until they reconnect. If your DBA edits postgresql.conf by hand instead, readiness picks up the change on its next probe because it reads live values.
Enabling log_verbose and compute_query_id after captures already exist starts a fresh drift lineage for the affected statements, because their ids change from syn:… to real query ids.
The server log read grant
The plug-in locates the current log with pg_current_logfile(), sizes it with pg_stat_file(), and reads it with pg_read_file() over JDBC. PostgreSQL does not let ordinary roles execute those functions, and this is the one privilege the plug-in deliberately never applies for you. Run it as a superuser, connected to the database the target monitors (function privileges are granted per database), substituting your monitoring role:
GRANT EXECUTE ON FUNCTION pg_current_logfile(), pg_current_logfile(text), pg_stat_file(text), pg_read_file(text, bigint, bigint) TO "<monitoring role>";
The Plan Capture (auto_explain) panel on Monitoring Readiness shows this statement with your actual role name and database already filled in, ready to copy. Membership in pg_read_server_files is not needed: with these grants the role can read the server log wherever log_directory points, and nothing else outside the data directory. (Releases before 24.1.3.0.0 / 13.5.17.0.0 asked for pg_read_server_files instead; a role that still holds it keeps working once the EXECUTE grants are in place, and the role membership can be revoked.)
Without the grant, all other monitoring works normally and no plans are captured, so Plan Analysis and Plan Drift Advisor stay empty. If the log is unreadable, the plug-in logs a warning and skips the harvest; collection never fails.
Optional extensions
Extensions are per-database. Run CREATE EXTENSION <name>; in each database you want covered. The plug-in detects extension presence on every collection and never installs anything. When an extension is absent, the feature it powers returns zero rows and its page section is simply empty, which is a healthy state, not an error.
| Extension | What it enables | Install |
|---|---|---|
hypopg |
What-If hypothetical-index simulations with projected speedups on Index Advisor. | PGDG package postgresql-<ver>-hypopg, then CREATE EXTENSION hypopg; |
pg_qualstats |
Predicate-based, filter-clause index recommendations on Index Advisor, including GIN and GIST. | PGDG package postgresql-<ver>-pg-qualstats, then CREATE EXTENSION pg_qualstats;. Needs the library in shared_preload_libraries, which means a restart |
pg_wait_sampling |
Wait-event sampling and the Wait Events chart on Query Analyzer. | PGDG package postgresql-<ver>-pg-wait-sampling, then CREATE EXTENSION pg_wait_sampling;. Needs the library in shared_preload_libraries, which means a restart |
pgstattuple |
Table bloat and avoidable-growth estimates on Vacuum Advisor. | Ships in the PostgreSQL contrib package, then CREATE EXTENSION pgstattuple; |
Install hypopg and pg_qualstats together. Catalog-native index detection works on every target with no extension at all, but the two extensions together give Index Advisor its full output: simulated cost validation from hypopg, observed-predicate recommendations from pg_qualstats.
For pg_wait_sampling, set pg_wait_sampling.profile_queries to all or top, otherwise the profile carries no per-query rows. The extension is not included in most PostgreSQL distributions and is not available on Windows, but most package managers carry it.
For pgstattuple, a monitoring role with pg_monitor already holds the pg_stat_scan_tables the estimate needs. See The monitoring role.
Preferred Credentials
Some plug-in pages read their data through Enterprise Manager jobs that run on the agent host, and those jobs need one Enterprise Manager Preferred Credential set on the PostgreSQL target: Agent Host Credentials, an operating-system login for the host where the agent that monitors the target runs. Set it once per target:
- Go to Setup, Security, Preferred Credentials, and open the PostgreSQL Database target type.
- On the My Preferences tab, under Target Preferred Credentials, select the target’s Agent Host Credentials row and click Set.
- Choose a named host credential for the agent host, or create one, then click Test and Save.
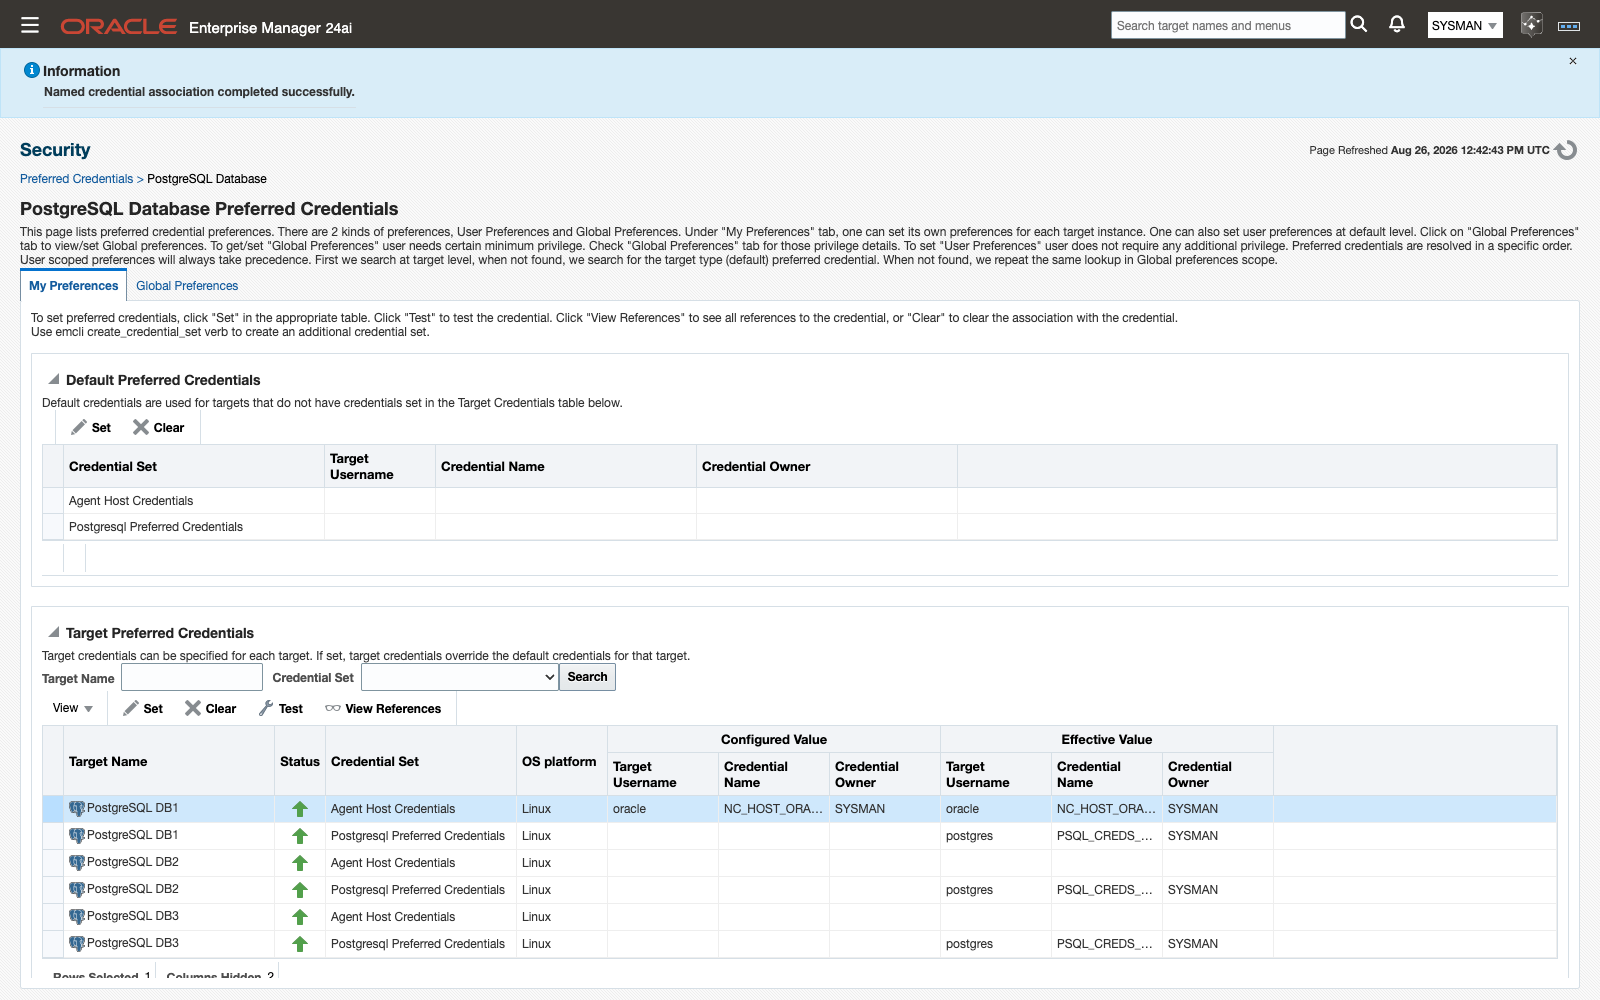
Agent Host Credentials set for one target under Target Preferred Credentials.
To cover every target of the type with one login, set it under Default Preferred Credentials on the same page instead. The jobs look up this set on the PostgreSQL target; Normal Host Credentials set on the host target itself do not satisfy them. The same page holds Postgresql Preferred Credentials, a database login that only the Backup and Restore jobs need. See Configuring and Using Target Credentials in the Oracle documentation.
Agent Host Credentials are needed by:
- Workload History
- Plan Analysis
- Plan Drift Advisor
- Retention Policies
- The “Autovacuum runs · 24h” KPI on Vacuum Advisor
- The Configure auto_explain action on Monitoring Readiness
When the set is missing, the page raises “Unable to run job. Verify Preferred Credentials are set for this target.”
Monitoring Readiness itself reads through the monitoring connection, not a job, so the page loads and reports status without Preferred Credentials. Only its Configure action needs them.
Agent host
Decide where the agent runs before you add targets. Both models are supported and collect the same metric data, apart from three local-only capabilities — the Logs page, the Kill Idle PostgreSQL Connections job (it runs psql on the agent host), and the collection throttle:
- Local agent, on the database host.
- Remote agent, connecting out to the database. Plan capture works here too, because the log is read over JDBC rather than from the filesystem.
Two things depend on that choice.
The collection throttle applies to local agents on Linux hosts. It skips heavier scheduled collections while agent-host CPU or memory sits above thresholds you set. On a remote agent the CPU reading would be the management host’s rather than the database host’s, so leave the throttle properties empty on remote-agent targets. Non-Linux agent hosts never throttle. The feature is off until you set a threshold. See Collection throttle properties and Collection throttle.
Disk headroom on the agent host for the agent-local history store, a SQLite file per target under %plugin_data% (<agent state directory>/ip_plugin/xpgs/data). The store is created automatically by the first collection that persists history; there are no manual steps. How large it gets is governed by three things you control: the capture threshold, the retention windows, and the store size ceilings. See Store size and disk reclaim.
Prerequisites checklist
Copy the list that matches what you want from the release.
Minimum (all existing monitoring)
- PostgreSQL 14-18
- Enterprise Manager 13.5.0.0.0+ or 24ai 24.1.0.0.0+
- A valid license key
- Plug-in OPAR imported, deployed to the OMS, deployed to the monitoring agent(s)
- Agent host on Linux 64-bit or Windows 64-bit, with a network path to the database (JDBC, port 5432 by default)
- Monitoring role created, with a matching
pg_hba.confentry for the agent host GRANT pg_monitor TO "<monitoring role>";(or equivalent read access to the statistics catalogs)track_activitiesandtrack_countson (PostgreSQL defaults)pg_stat_statementsinshared_preload_libraries, andCREATE EXTENSION pg_stat_statements;in each monitored database- Agent Host Credentials set for the target under Enterprise Manager Preferred Credentials
- Disk headroom on the agent host for the agent-local history store
Full advisory capability (adds to the minimum)
auto_explainmodule installed on the database server (contrib package)logging_collector = onlog_destination = stderr(notcsvlog, notjsonlog)log_line_prefixbegins with%msession_preload_librariesincludesauto_explainauto_explain.log_min_durationset to your capture threshold in milliseconds,0or higherauto_explain.log_format = jsonauto_explain.log_analyze = on, applied together withauto_explain.log_timing = onauto_explain.log_verbose = oncompute_query_id = on, orautowithpg_stat_statementspreloadedGRANT EXECUTE ON FUNCTION pg_current_logfile(), pg_current_logfile(text), pg_stat_file(text), pg_read_file(text, bigint, bigint) TO "<monitoring role>";run by a superuser in the monitored database- Optional:
hypopgandpg_qualstatsfor the full Index Advisor output - Optional:
pg_wait_sampling, withpg_wait_sampling.profile_queriesset toallortop - Optional:
pgstattuple(no extra grant: thepg_stat_scan_tablesit needs comes withpg_monitor)
The six auto_explain and compute_query_id rows above are applied for you by Configure auto_explain on Monitoring Readiness. The rest are yours to set.
Related
- Install and upgrade — import the OPAR and deploy it to the OMS and agents
- Targets and properties — add targets and set the throttle properties
- Monitoring Readiness — check every prerequisite live, and apply the
auto_explainsettings - History store and retention — what the agent-local store holds and how to bound its size