Monitoring pages
If you came here from the Advisors pages, you already know where plan drift, index and vacuum health, and workload trends live. Everything else lives on the pages below: current connections, table and index growth, currently running and blocked queries, the server log, license status, and the PostgreSQL Cluster target’s switchover control.
Prerequisites for this page
- Query Analyzer’s statement list and history read from
pg_stat_statements— see Statement statistics (pg_stat_statements).- Query Analyzer’s Wait Events chart needs the optional
pg_wait_samplingextension — see Optional extensions and Wait-event sampling.- The Logs page needs a local Enterprise Manager agent (installed on the same host as the PostgreSQL server) and a configured log file path — see Logs, below.
- Cluster switchover and the Cluster Events (Patroni) metric need Patroni REST API monitoring enabled on the cluster target.
Where to find it: PostgreSQL Database target navigation tree (Overview, Configuration, and Realtime at the top level; Database, Tables, Indexes, Queries, and Query Analyzer under each database name; License Info at the bottom). PostgreSQL Cluster target: the cluster’s target home page.
In this page: Database target pages · Realtime pages · Schema inventory metrics · Cluster target
Database target pages
Overview, Configuration, and License Info apply to the whole target. Database, Tables, Indexes, Queries, and Query Analyzer are scoped to one database at a time — pick the database from the tree first.
Overview
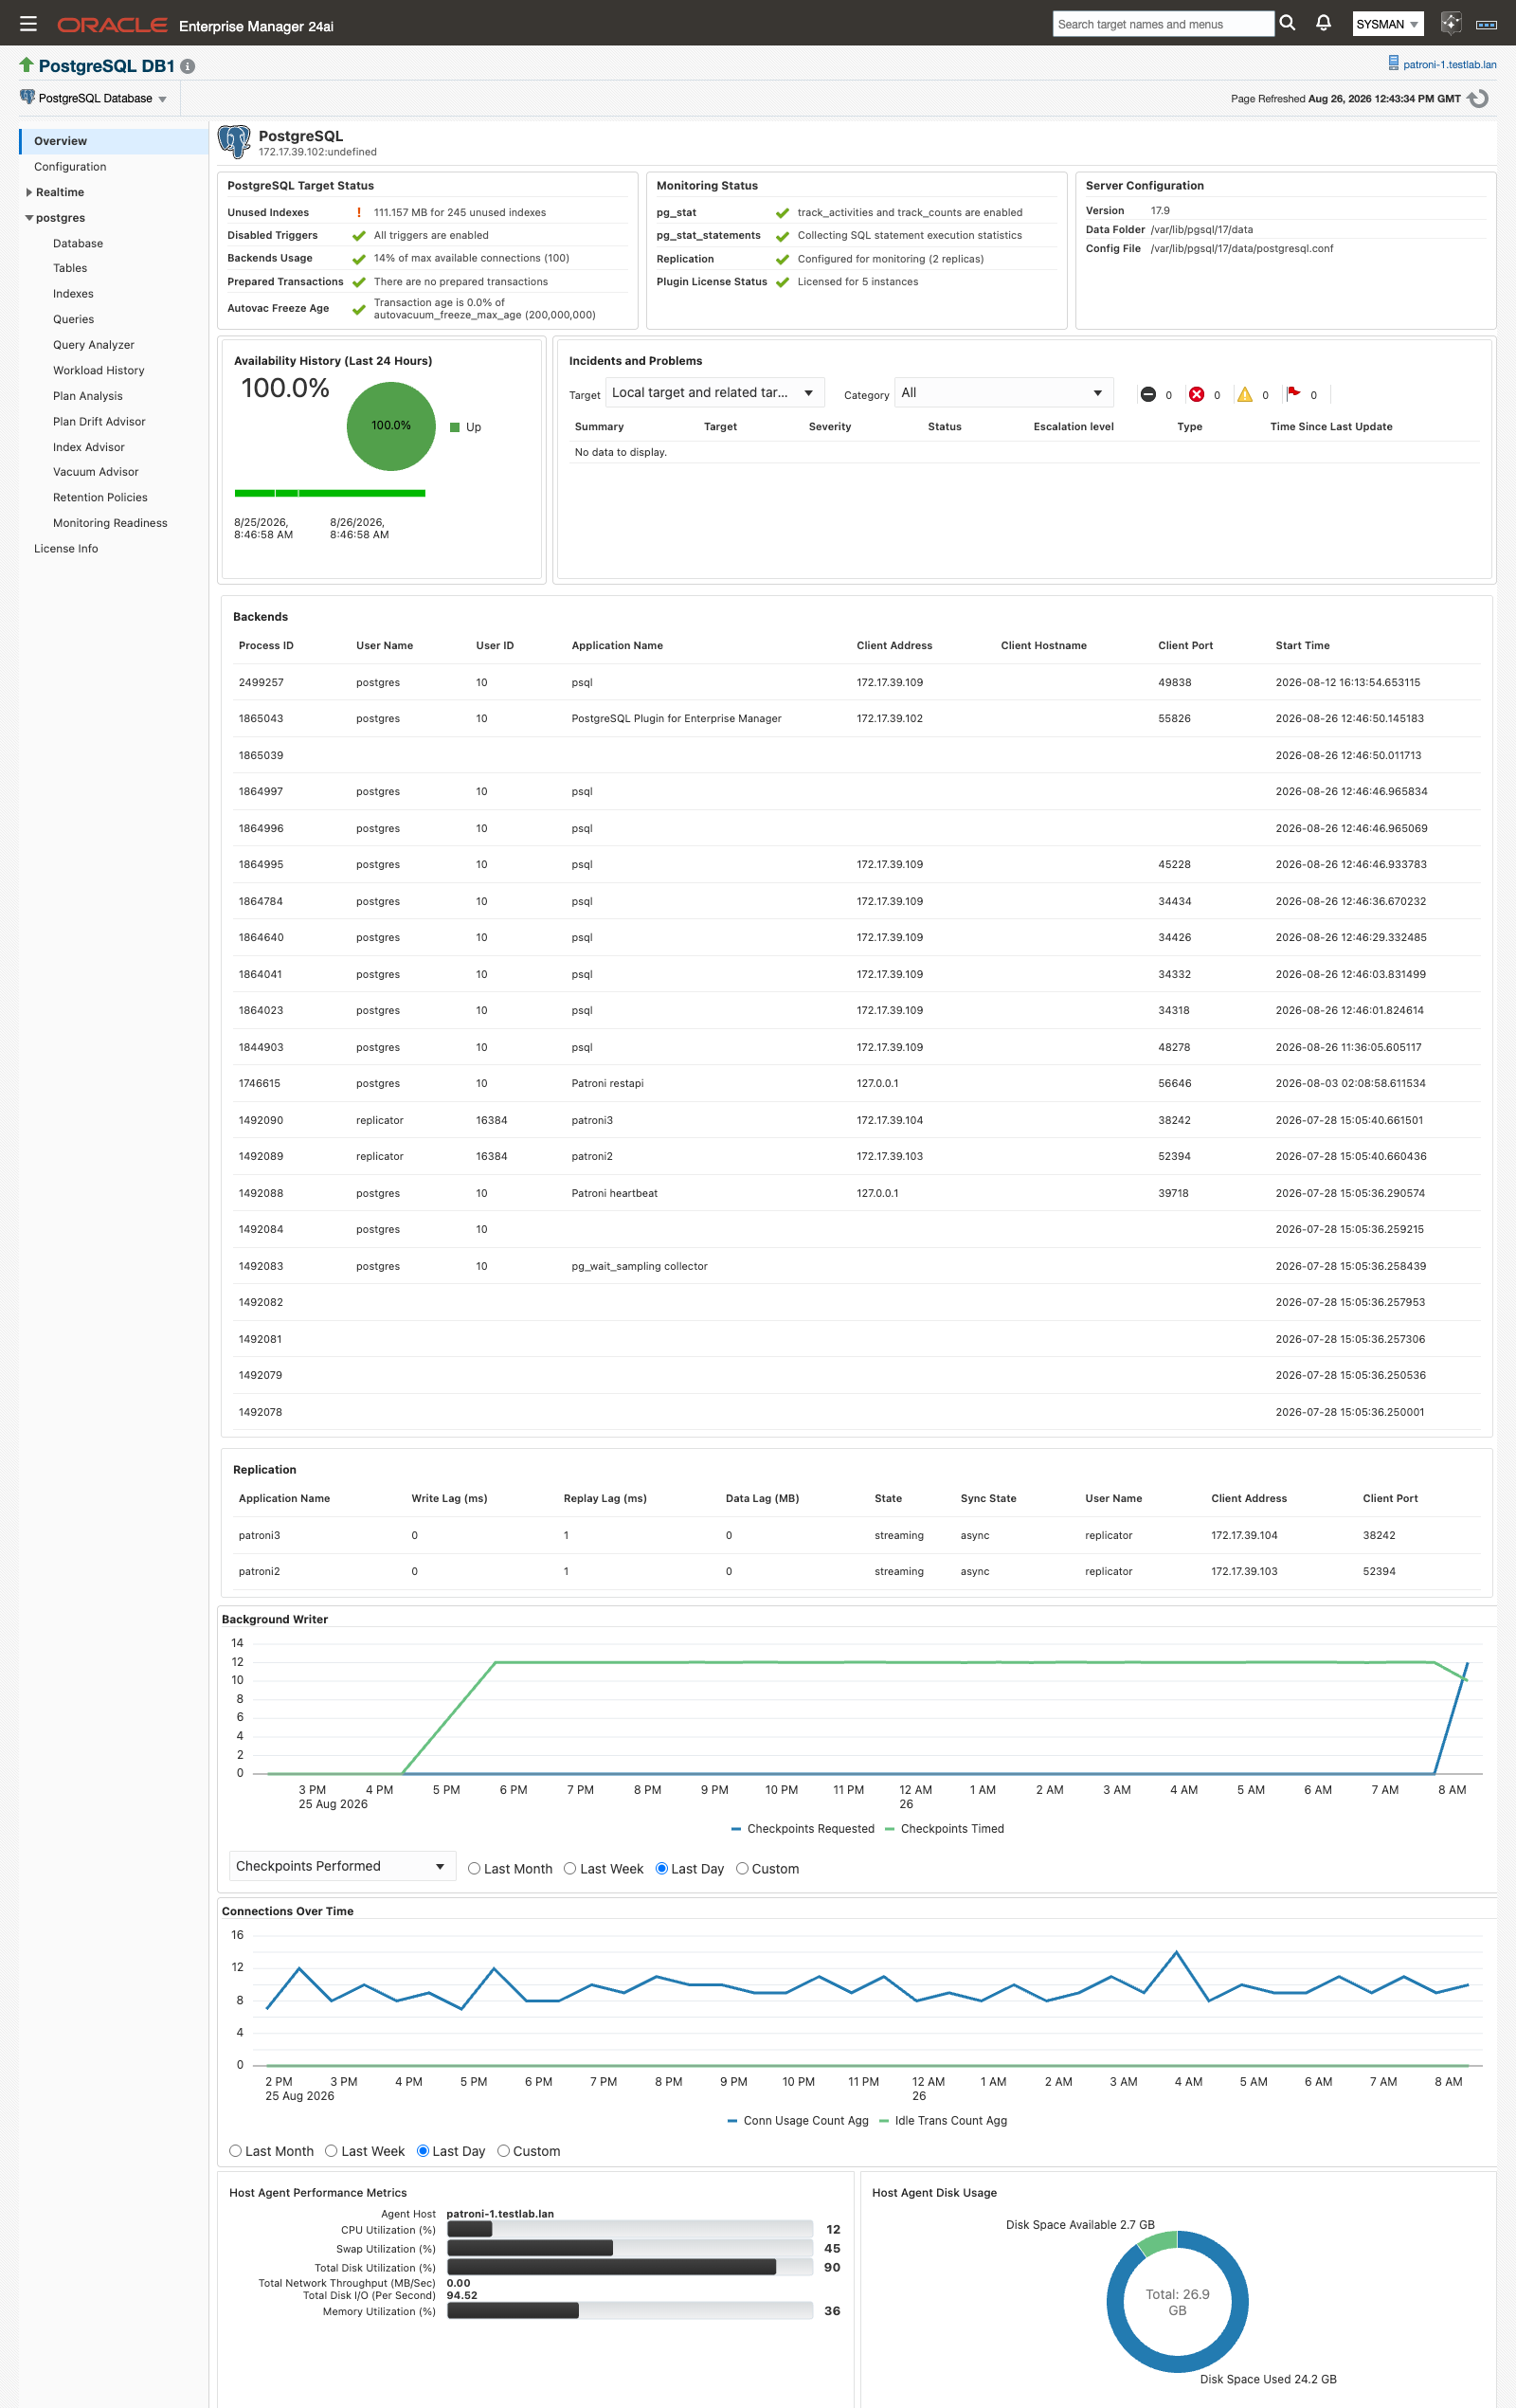
Overview: target status, incidents, and the Backends, Replication, Background Writer, and Connections Over Time regions.
Overview is the target’s landing page. Open it first to see whether a target is healthy at a glance, before drilling into a specific database. It opens on three status panels: PostgreSQL Target Status (unused indexes, disabled triggers, backends usage, prepared transactions, autovacuum freeze age), Monitoring Status (pg_stat, pg_stat_statements, replication, and plug-in license status), and Server Configuration (PostgreSQL version, data directory, config file path). Below those, availability and open incidents, then a Backends table (process ID, user, application, client address/hostname/port, start time) and a Replication table (application name, write/replay lag, data lag, state, sync state, client info) for any streaming replicas. Background Writer and Connections Over Time are trend charts you can switch between Last Day, Last Week, Last Month, or a custom range.
Configuration
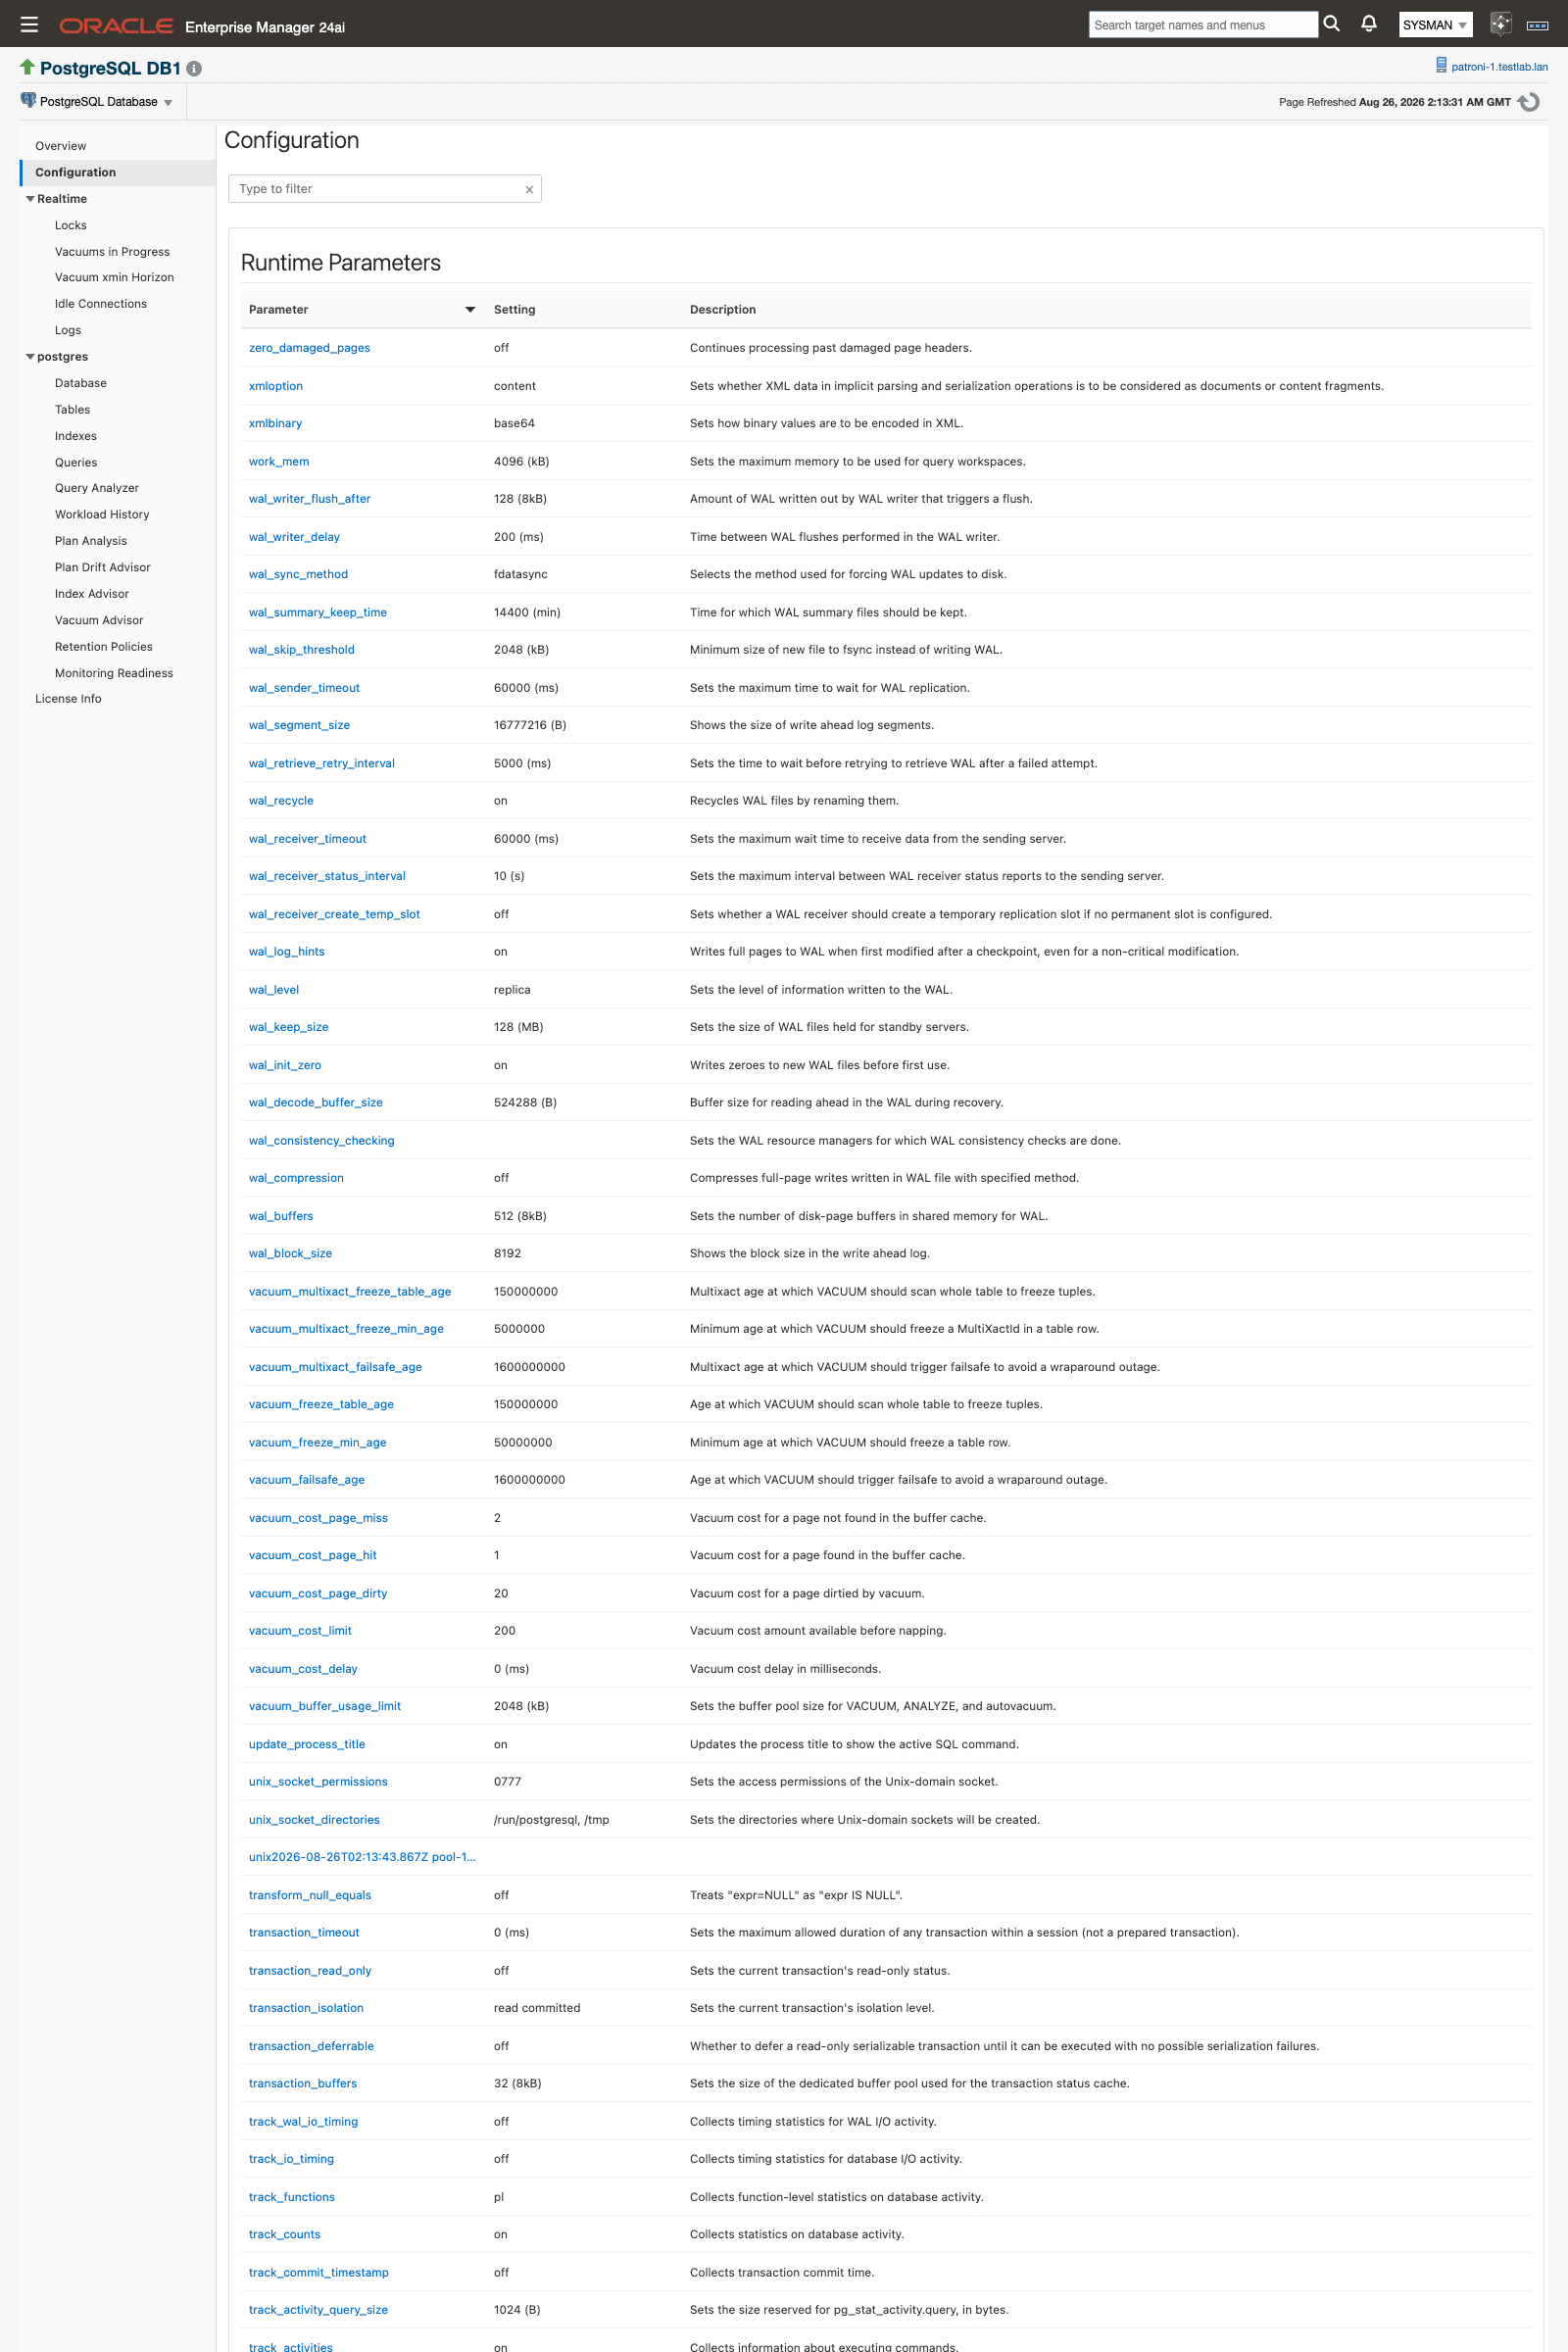
Configuration: every postgresql.conf parameter with its live and boot-time state.
Configuration lists every runtime parameter PostgreSQL reports, one row per parameter:
| Column | Shows |
|---|---|
| Parameter | The setting name |
| Setting | The current value |
| Description | PostgreSQL’s short description |
| Unit / Value Type / Category | The unit, data type, and configuration category PostgreSQL reports |
| Source / Context | Where the value came from, and when a change takes effect |
| Boot Value | The value that applies at the next server restart |
| Reset Value | The value pg_settings.reset_val reports |
Database
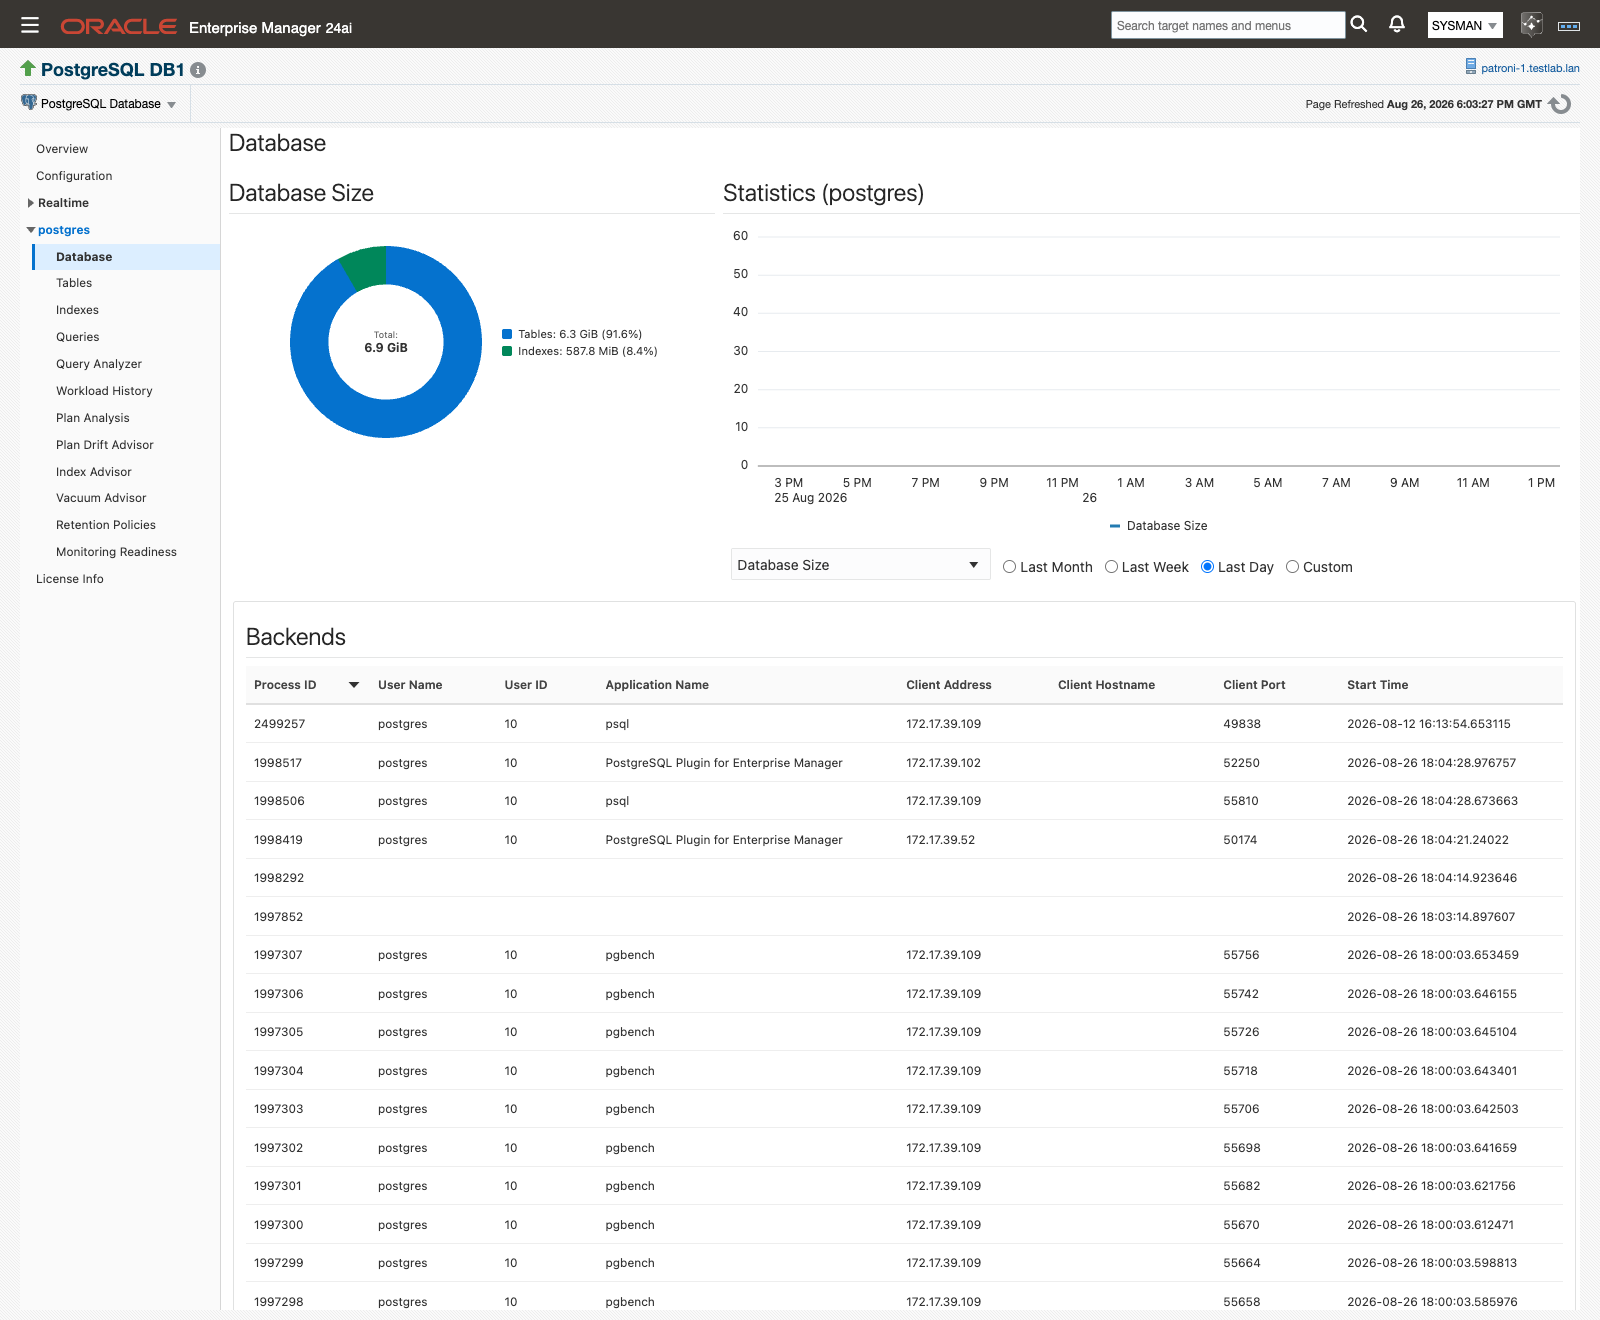
Database: size and statistics charts for the selected database, plus its live backends.
Database shows the selected database’s size and a Statistics chart you can plot against Database Size, Transactions, Blocks Read and Hit, Block Read Time and Write Time, Row Access Counts, Deadlocks and Conflicts, or Conflict Details. A Backends table below lists the connections currently open to that database.
Tables
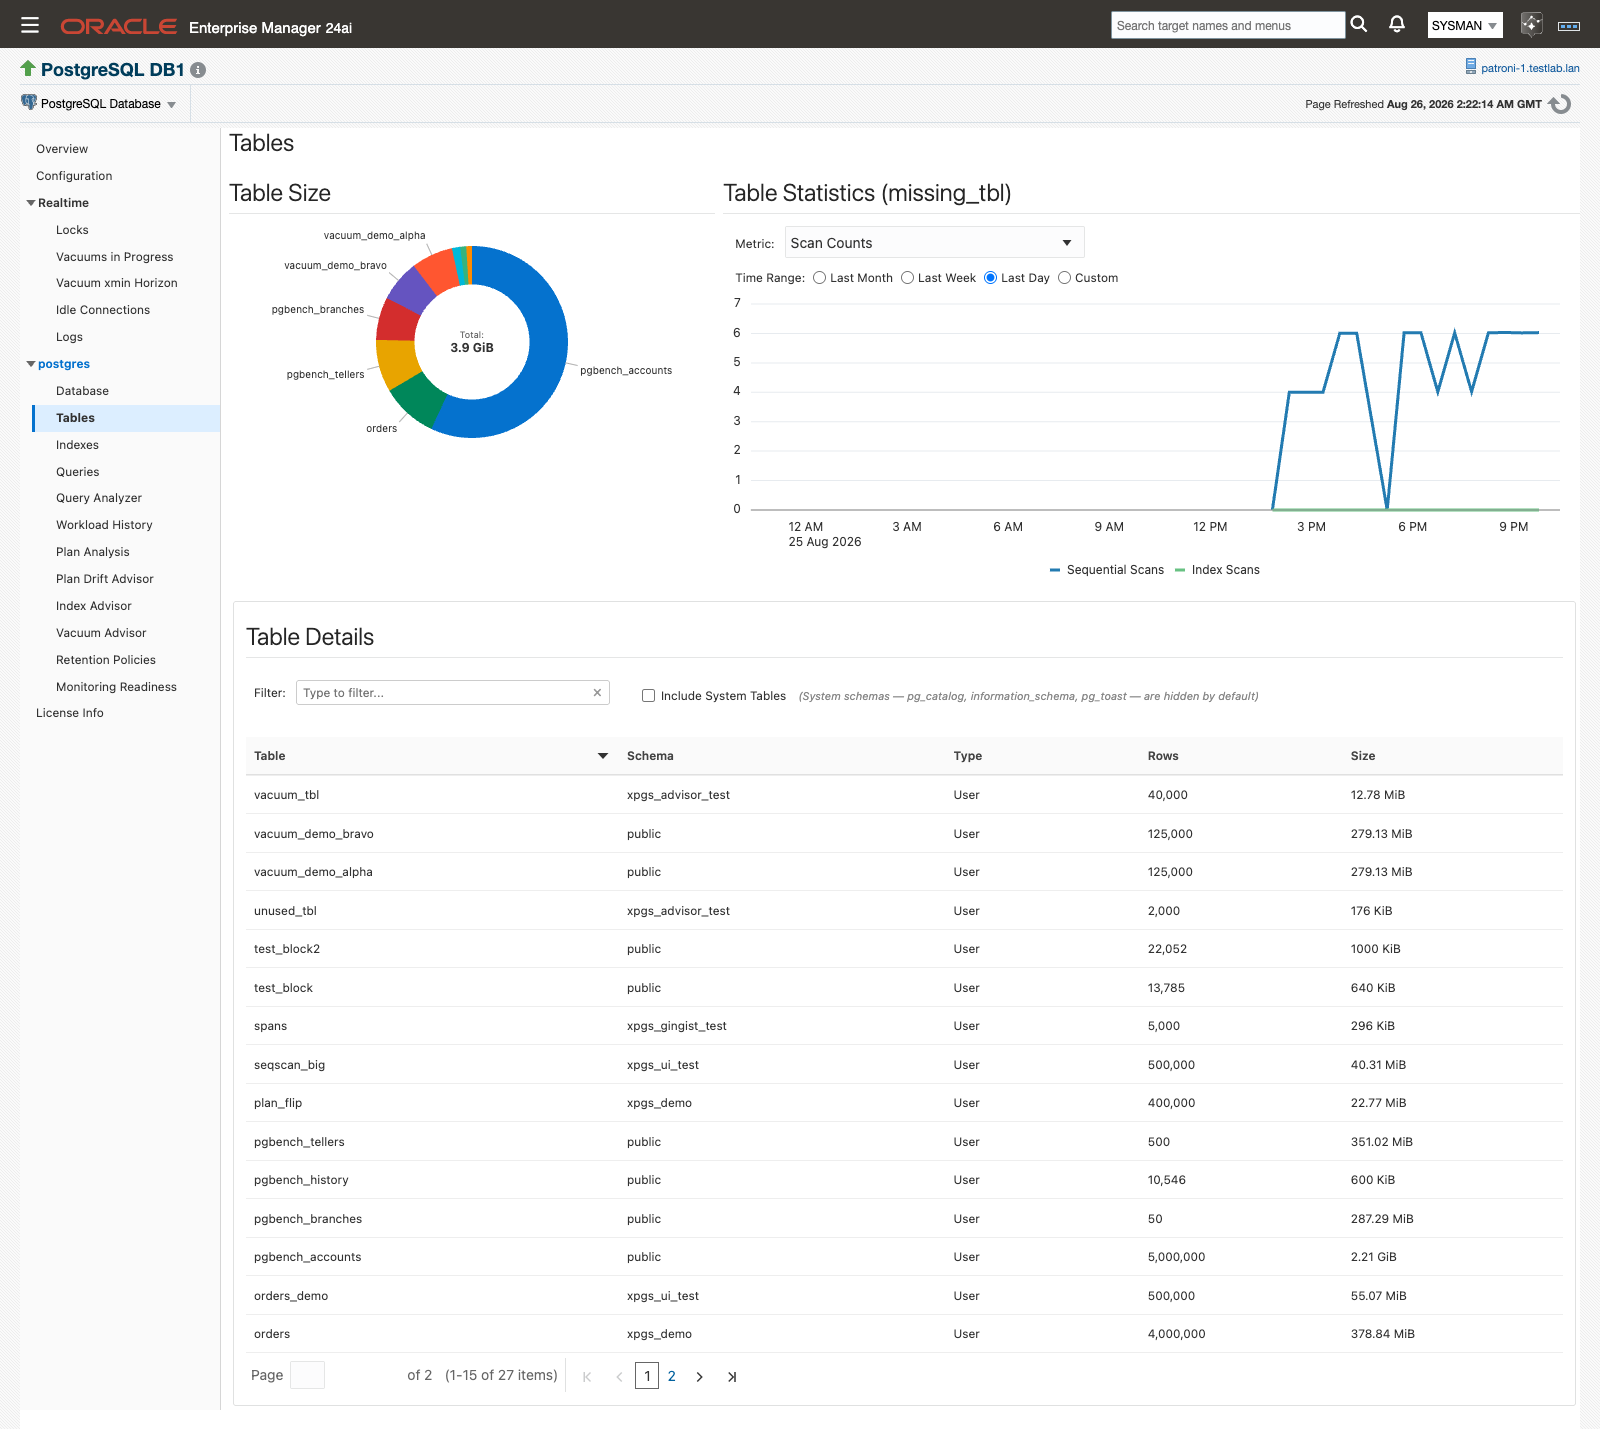
Tables: size and statistics for every table in the selected database.
Tables breaks table size down per table, with a Table Statistics chart selectable across Scan Counts, Rows Fetched by Scan Type, Rows Inserted/Fetched/Updated/Deleted, Live/Dead Rows, Table Maintenance, Heap Blocks, Index Blocks, Toast Blocks, and Toast Index Blocks. The Table Details list below shows Table, Schema, Type, Rows, and Size for every table, so you can find and drill into one quickly.
Indexes
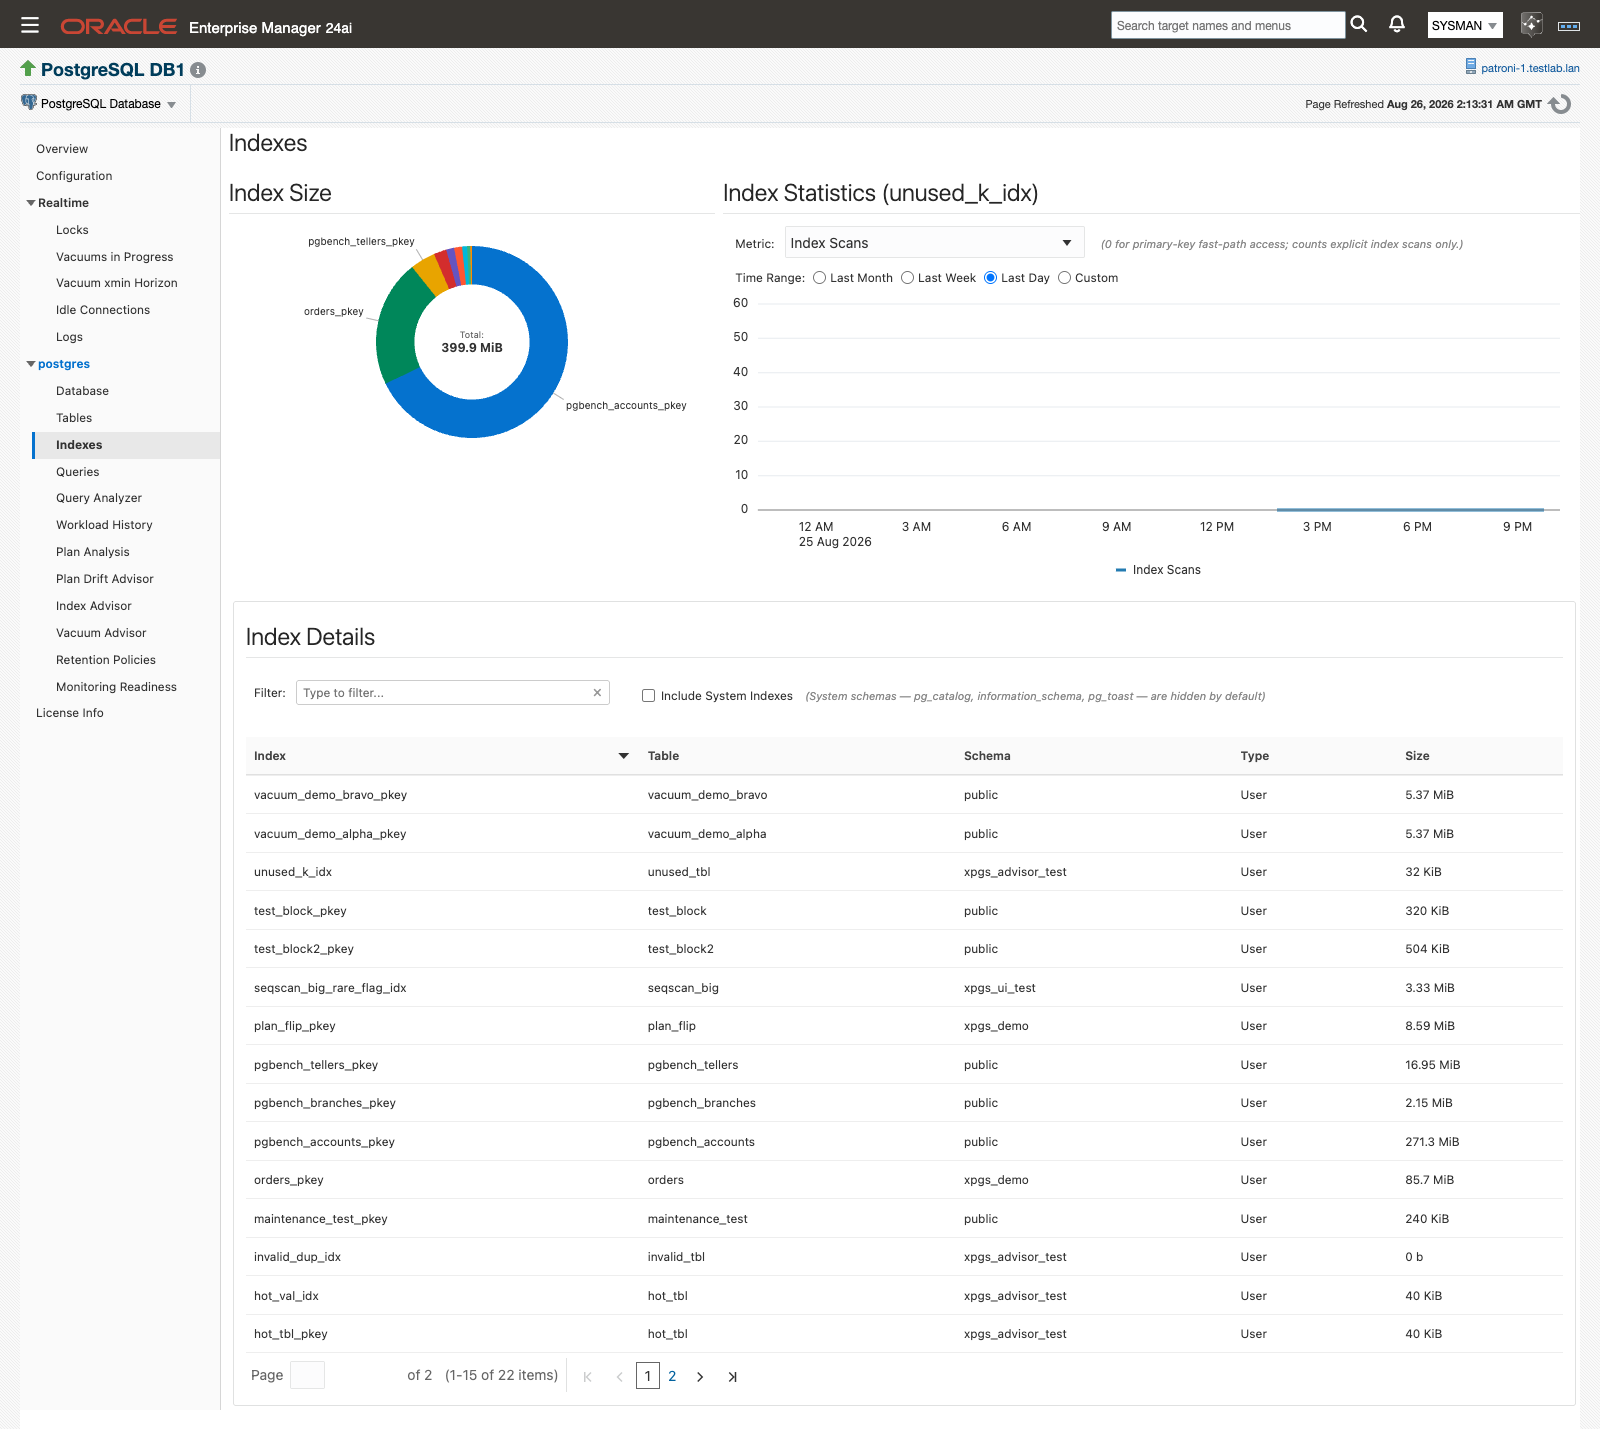
Indexes: size and statistics for every index in the selected database.
Indexes is the same idea applied to indexes: an Index Statistics chart (Index Scans, Index Entries Read, Table Rows Fetched, Disk Blocks) and an Index Details list of Index, Table, Schema, Type, and Size. Open it when you’re chasing index bloat or confirming whether an index is actually being scanned before deciding to drop it.
Queries
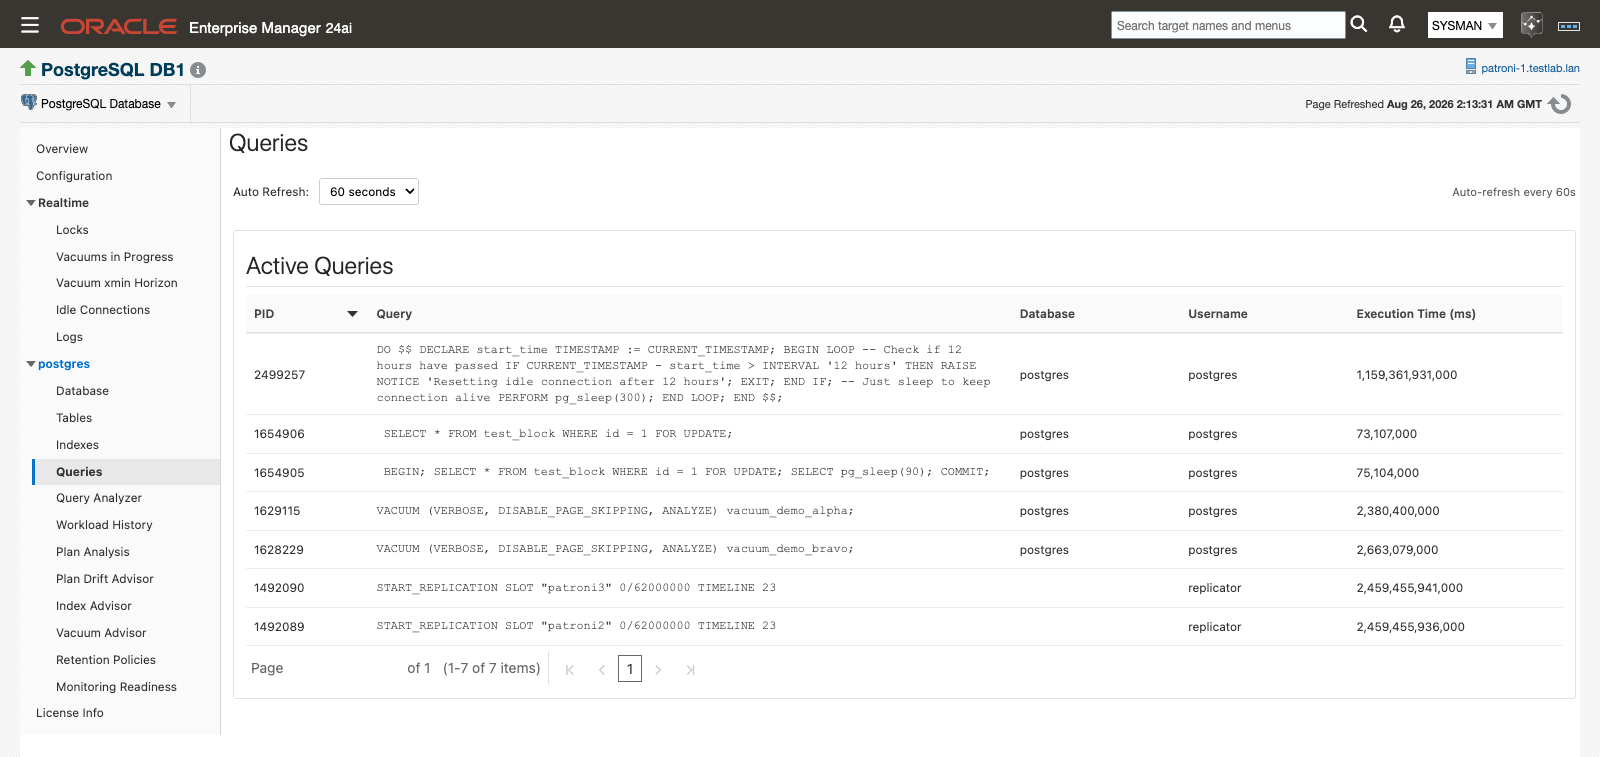
Queries: what’s executing right now, refreshed live.
Queries is a live view of currently executing statements from pg_stat_activity, not a history — it works the same way as the Realtime pages, with an Auto Refresh selector (No Refresh, 15, 30, or 60 seconds). Each row shows PID, Query, Database, Username, and Execution Time (ms). For statement-level history and aggregated statistics, use Query Analyzer below.
Query Analyzer
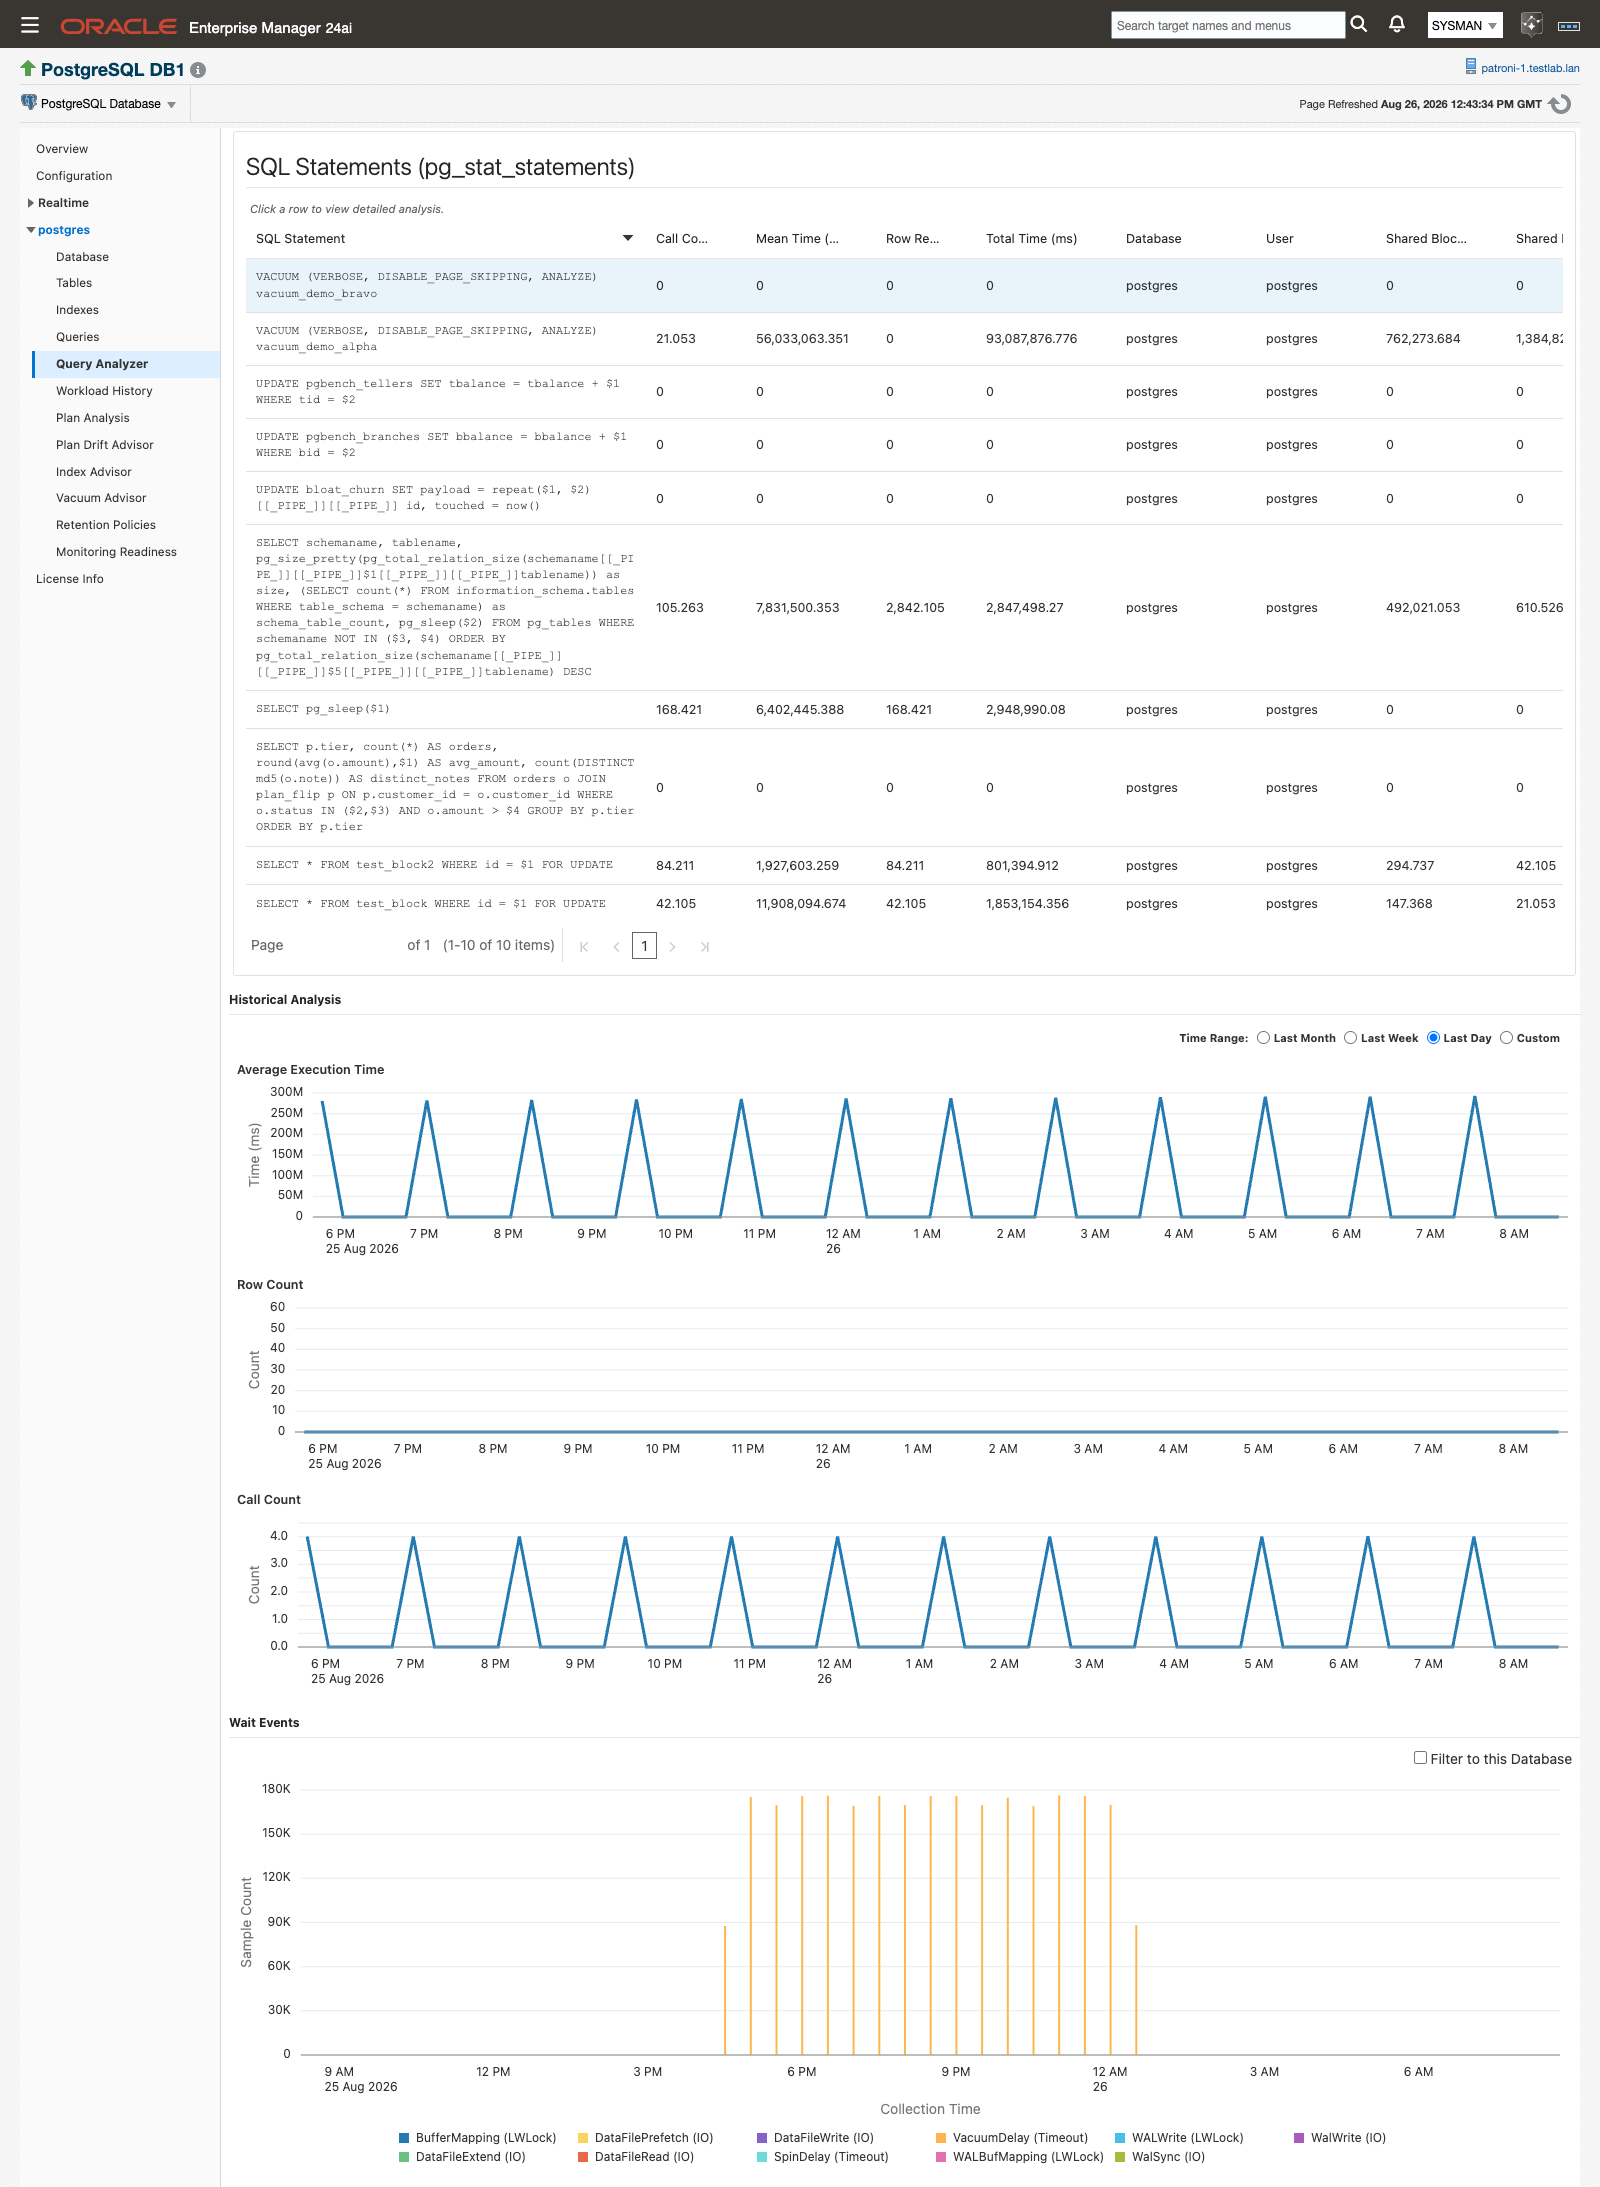
Query Analyzer: the pg_stat_statements view of a database’s statements, with per-statement history.
Query Analyzer lists the database’s statements from pg_stat_statements; selecting one opens its per-statement detail and historical charts, plus the Wait Events chart of wait-event counts sampled for that statement over time. See Wait-event sampling for what the extension needs and how the chart reads it.
When a selected statement has plan-drift captures, a “View this query in Plan Drift Advisor →” link appears above the detail panels and takes you straight to that query, preselected, on Plan Drift Advisor. Testing a proposed query rewrite is no longer done on this page — it happens in the Fix Workbench on Plan Drift Advisor, the only place in the plug-in that executes a statement on your behalf, and only on your explicit click. (The Index Advisor’s HypoPG simulation also runs an EXPLAIN, but a plan-only EXPLAIN (FORMAT JSON) that executes nothing.)
License Info
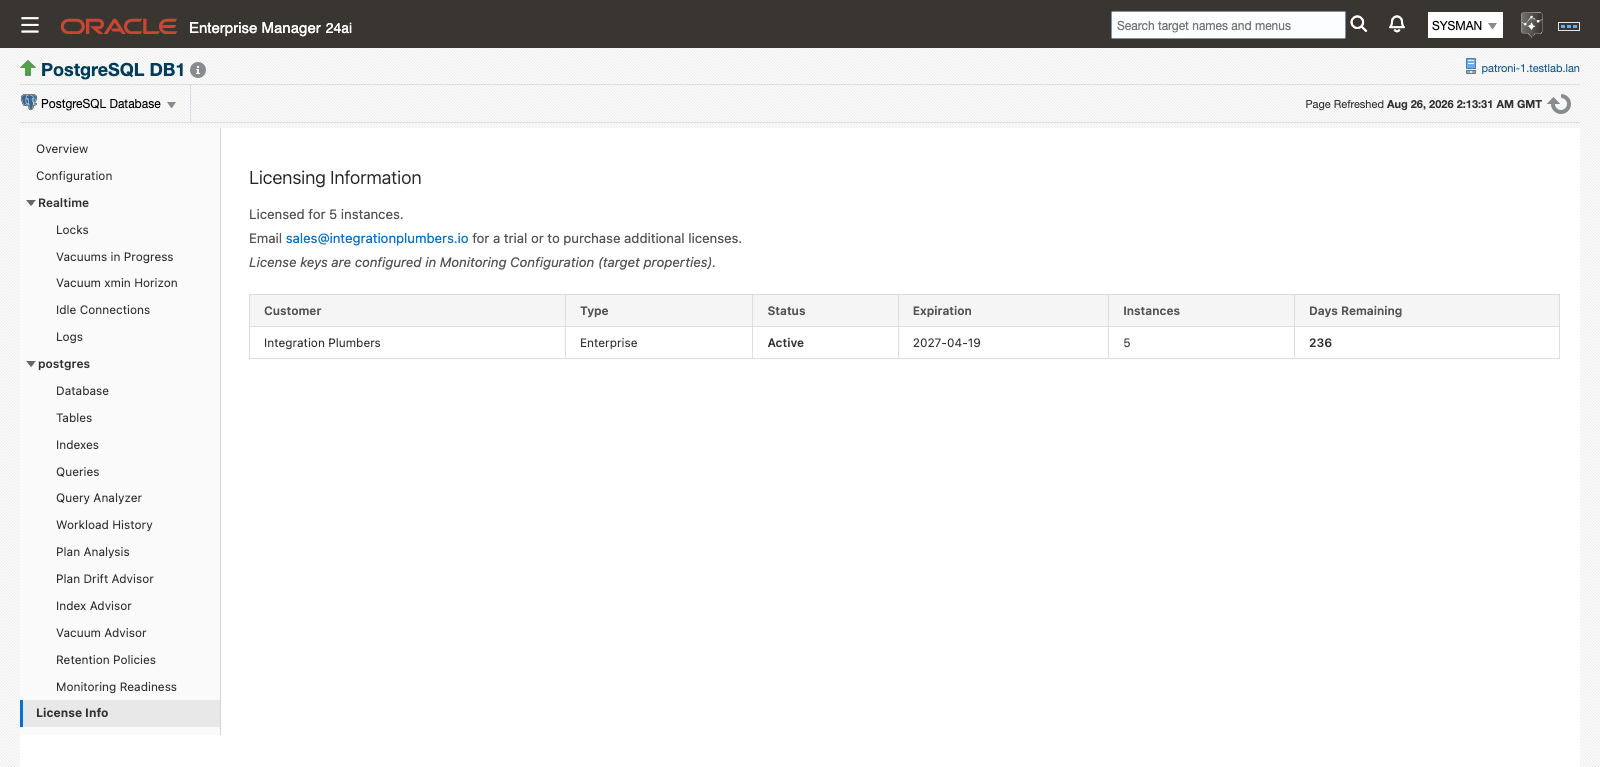
License Info: the license record recognized for this target.
License Info shows the license the plug-in recognizes for the target:
| Column | Shows |
|---|---|
| Customer | The name the license is issued to |
| Type | The license type |
| Status | Current license status |
| Expiration | Expiration date |
| Instances | Number of instances the license covers |
| Days Remaining | Days left before expiration |
With no license recognized, the table reads “No licenses configured”. License keys are entered per target in the Plugin License target property, in Monitoring Configuration. See Database target properties. Email sales@integrationplumbers.io for a trial or to purchase additional licenses.
Realtime pages
The pages under Realtime query the target live, on demand, each with an Auto Refresh selector (No Refresh, 15, 30, or 60 seconds) that controls how often it re-queries while you have the page open. Two of the metrics behind these pages also collect on their own fixed schedule and carry alert thresholds: Vacuum xmin Horizon collects every 30 minutes with Warning and Critical bands (see Vacuum Advisor), and Log Stats, behind the Logs page below, collects every 5 minutes once the collection is enabled in Metric and Collection Settings.
Locks
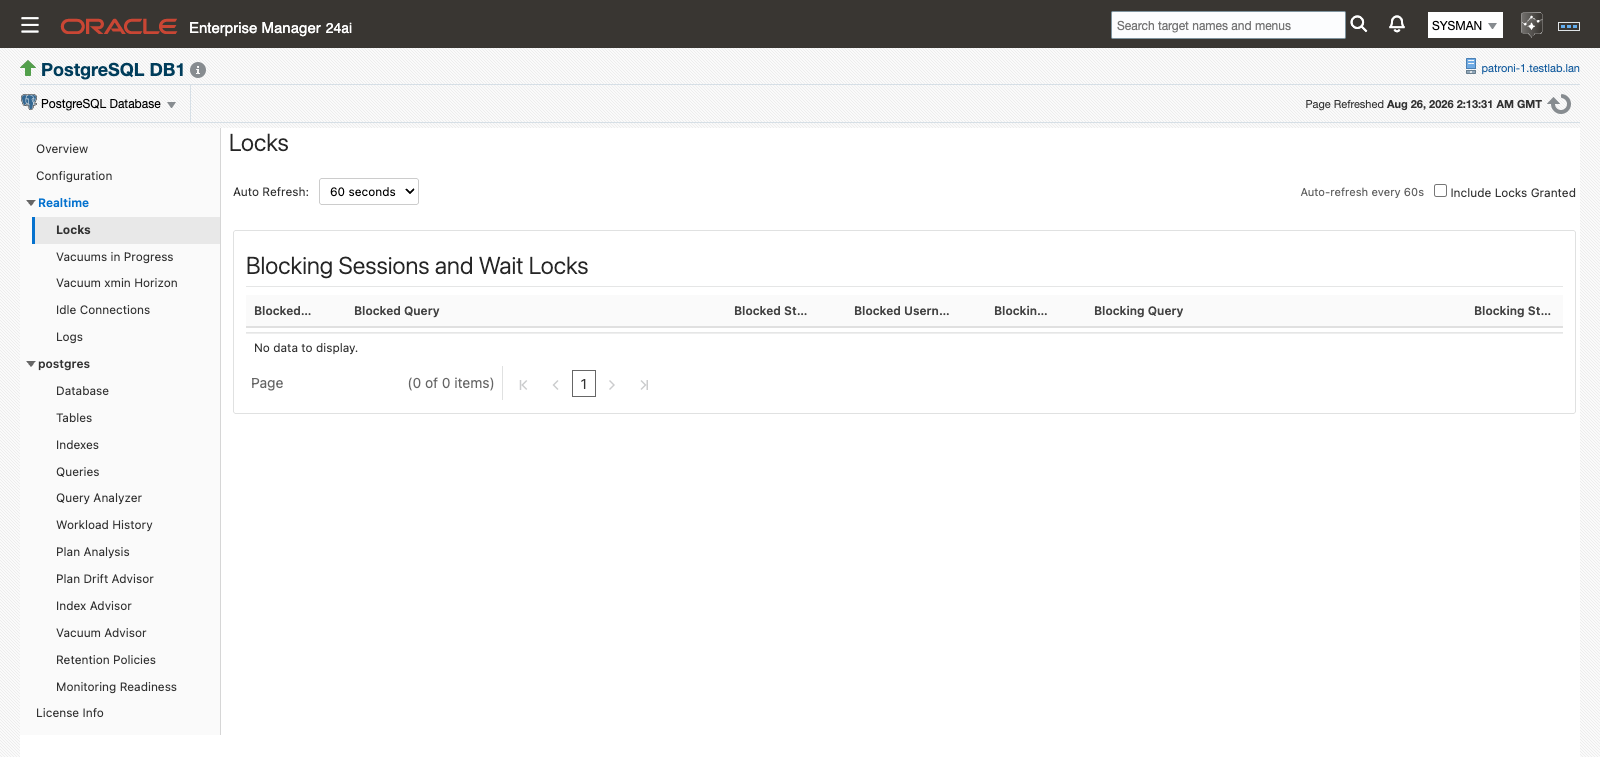
Locks: blocking sessions and the lock waits behind them.
Locks shows blocking sessions and lock waits: for each blocked query, the session and query holding the lock it’s waiting on. The tree entry reads Locks, and the page heading reads “Blocking Sessions and Wait Locks”, its name in the older guide. The table has one row per blocked/blocking pair — Blocked PID, Blocked Query, Blocked State, Blocked Username, Blocking PID, Blocking Query, Blocking State, Blocking Username, and Lock Granted. By default it shows only queries that are actually blocked; check Include Locks Granted to also show granted locks in the same view.
Vacuums in Progress and Vacuum xmin Horizon
Vacuums in Progress and Vacuum xmin Horizon are documented with the rest of vacuum monitoring on Vacuum Advisor, which owns both pages: Vacuums in Progress shows running VACUUM operations phase by phase, and Vacuum xmin Horizon shows what’s currently holding back cleanup and the command to release it.
Idle Connections
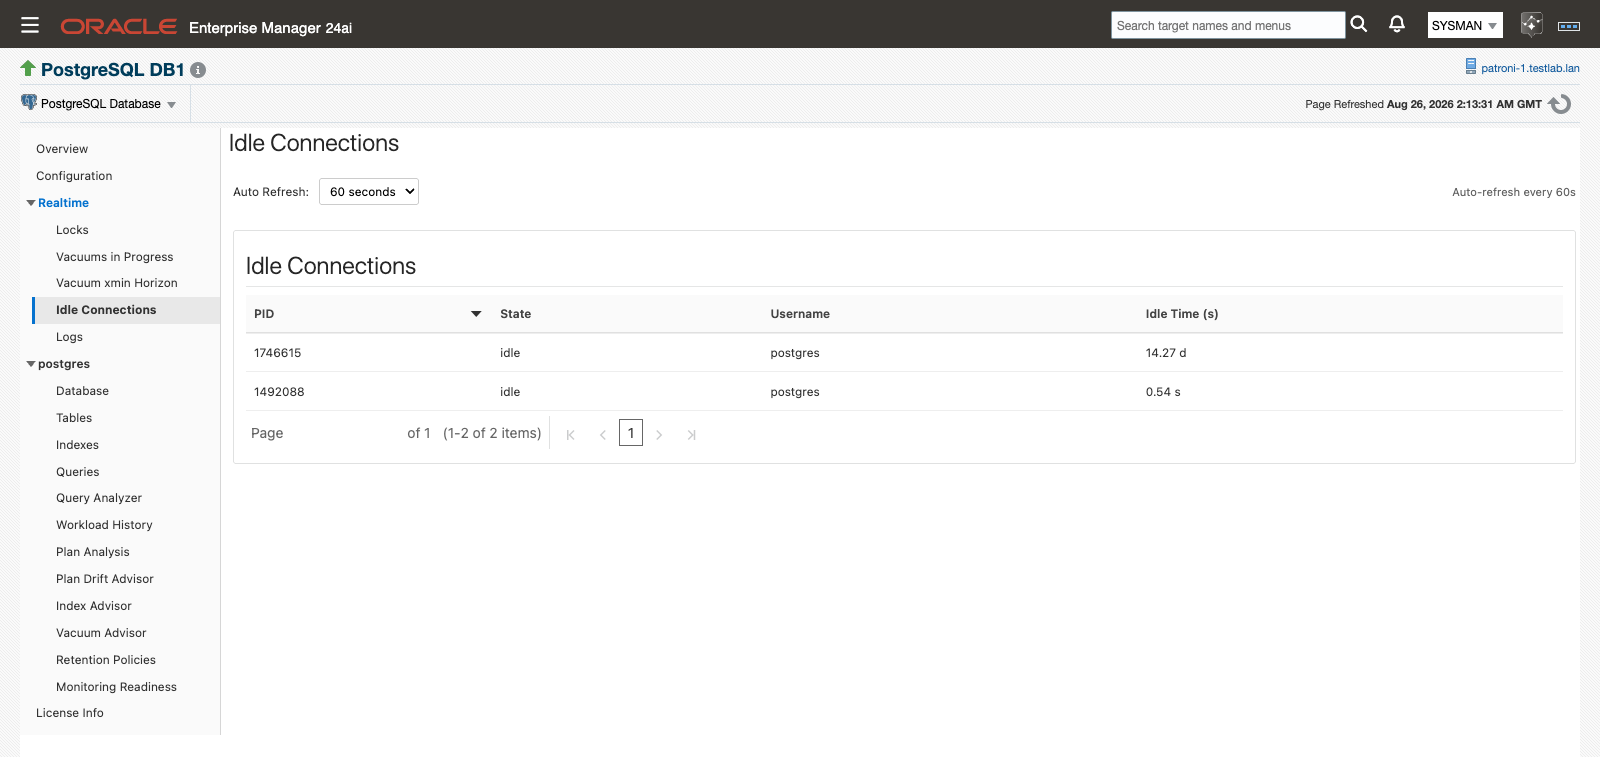
Idle Connections: sessions sitting idle right now.
Idle Connections lists currently idle PostgreSQL sessions: PID, State (for example idle or idle in transaction), Username, and Idle Time (s). To terminate idle connections directly rather than just observe them, use the Kill Idle PostgreSQL Connections job.
Logs
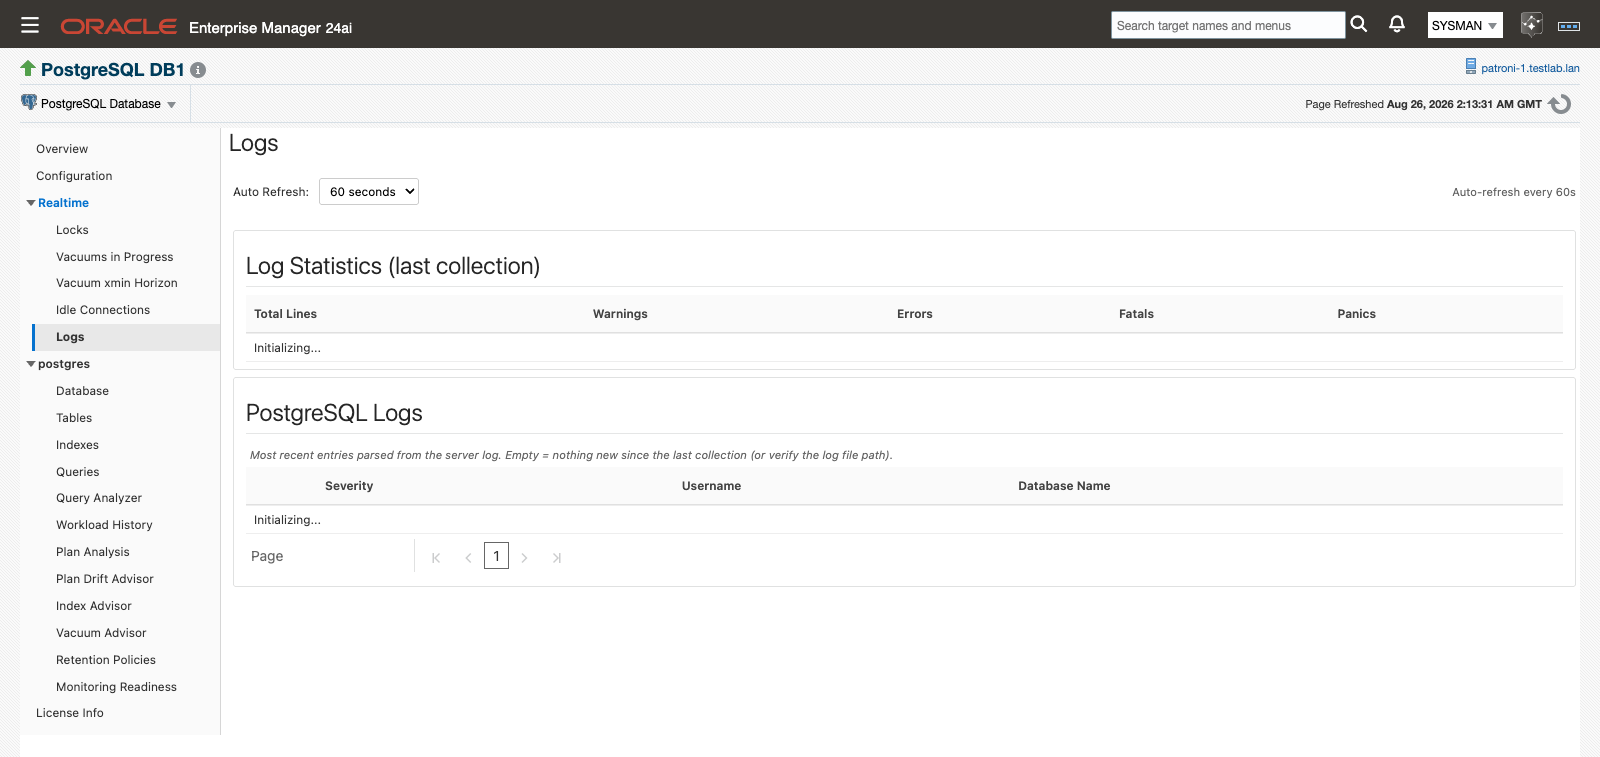
Logs: recent log-statistic counts and the most recent parsed log entries.
Logs shows the PostgreSQL server log. A Log Statistics (last collection) panel reports Total Lines, Warnings, Errors, Fatals, and Panics; it refreshes every 5 minutes once the collection is enabled in Metric and Collection Settings, regardless of the Auto Refresh setting, which controls only the entries table below it. The PostgreSQL Logs table shows the last 500 lines of the configured log file, parsed into Timestamp, Severity, PID, Username, Database Name, and Message. An empty table means nothing new has been parsed since the last collection, or the log file path needs a second look.
This feature works only when the Enterprise Manager agent is local — installed on the same host as the PostgreSQL server. It does not support remote log collection.
Setup
- Enable logging in PostgreSQL. PostgreSQL doesn’t log to a file by default:
- Set
log_directoryandlog_filename, and setlogging_collector = oninpostgresql.conf. - Reload or restart PostgreSQL.
- Confirm the OMA (agent) user can read the log file.
- Set
- Configure the log file path in the plug-in. On the target’s Monitoring Configuration page (target menu ▸ Target Setup ▸ Monitoring Configuration), enter the full path in Path to postgres log file. See Database target properties. The path must point to a file readable by the agent on the same host; remote paths aren’t supported.
- Enable the Log Statistics collection. Setting the path does not enable it. Open the target’s Metric and Collection Settings, find Log Statistics, and enable the collection; it then runs every 5 minutes. The shipped monitoring templates do not enable it either. The PostgreSQL Logs table needs only the path.

Setting the “Path to postgres log file” target property.
Schema inventory metrics
The plug-in collects four schema-inventory metrics every 30 minutes: Trigger, Prepared Transactions, Sequences, and User Function. They’re descriptive inventory, not a page in the tree — find them under the target’s All Metrics tab (target home page → All Metrics → metric name).
| Metric | Internal name | Shows |
|---|---|---|
| Trigger | triggers |
Database Name, Table ID, Trigger Name, Function ID, Enabled State, and Is Internal (whether the trigger is system-generated). Table and function are identified by ID, not name |
| Prepared Transactions | prepared_transactions |
Transaction ID, global transaction ID, prepared time, owner, and database — useful for finding stuck two-phase-commit transactions |
| Sequences | sequences |
Database, schema, sequence name, sequence type, and blocks read/hit |
| User Function | user_functions |
Schema, function name, call count, total time, and self time. Requires track_functions = 'all' in postgresql.conf |
Enterprise Manager’s repository persists only numeric metric columns for historical trending. Because these metrics are mostly text (names, states, identifiers), there is little for it to chart. Use the live view under All Metrics to inspect current state.
Cluster target
Cluster home
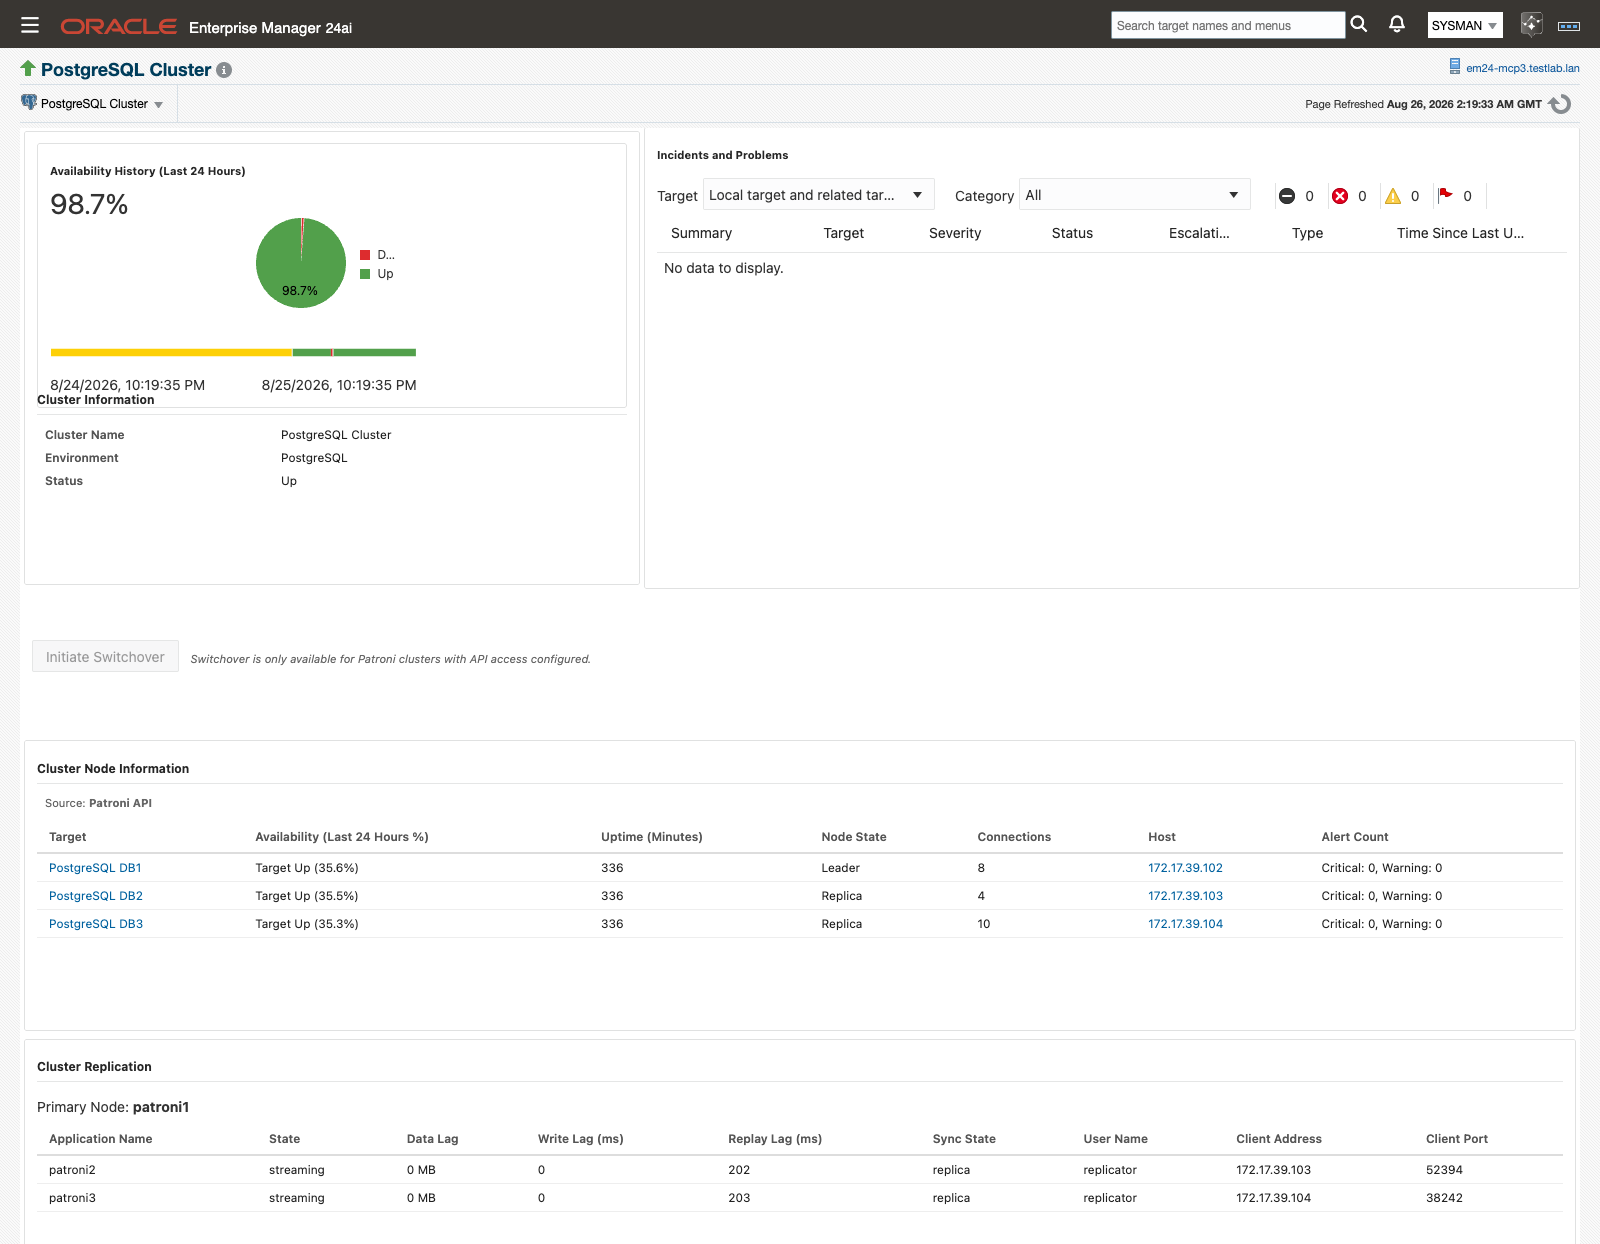
Cluster home: cluster identity, availability and incidents, node information, and replication.
The PostgreSQL Cluster target’s home page opens on Cluster Information (cluster name, environment, status) next to availability and open incidents, then Cluster Node Information, listing each member’s Target, Availability (Last 24 Hours %), Uptime (Minutes), Node State, Connections, Host, and Alert Count, and Cluster Replication, which names the current primary and lists each replica’s application name, state, data lag, write/replay lag, sync state, and client info. Open it to check cluster-wide health or run a switchover, rather than drilling into one member’s database target.
The empty state reads “No Patroni cluster data available.” Allow up to 24 hours after a Patroni configuration change for the first collection to register; if it persists, verify patroni_hosts and patroni_port are reachable from the agent host.
Patroni switchover
For clusters monitored with the Patroni API mode enabled, the cluster home page carries an Initiate Switchover button. For any other cluster, the button is disabled with the message “Switchover is only available for Patroni clusters with API access configured.”
- Click Initiate Switchover.
- In the confirmation dialog, optionally pick a Target Node — leave it at “Let Patroni Choose (Recommended)” to let Patroni select the best available standby, or name one explicitly.
- Click Confirm Switchover.
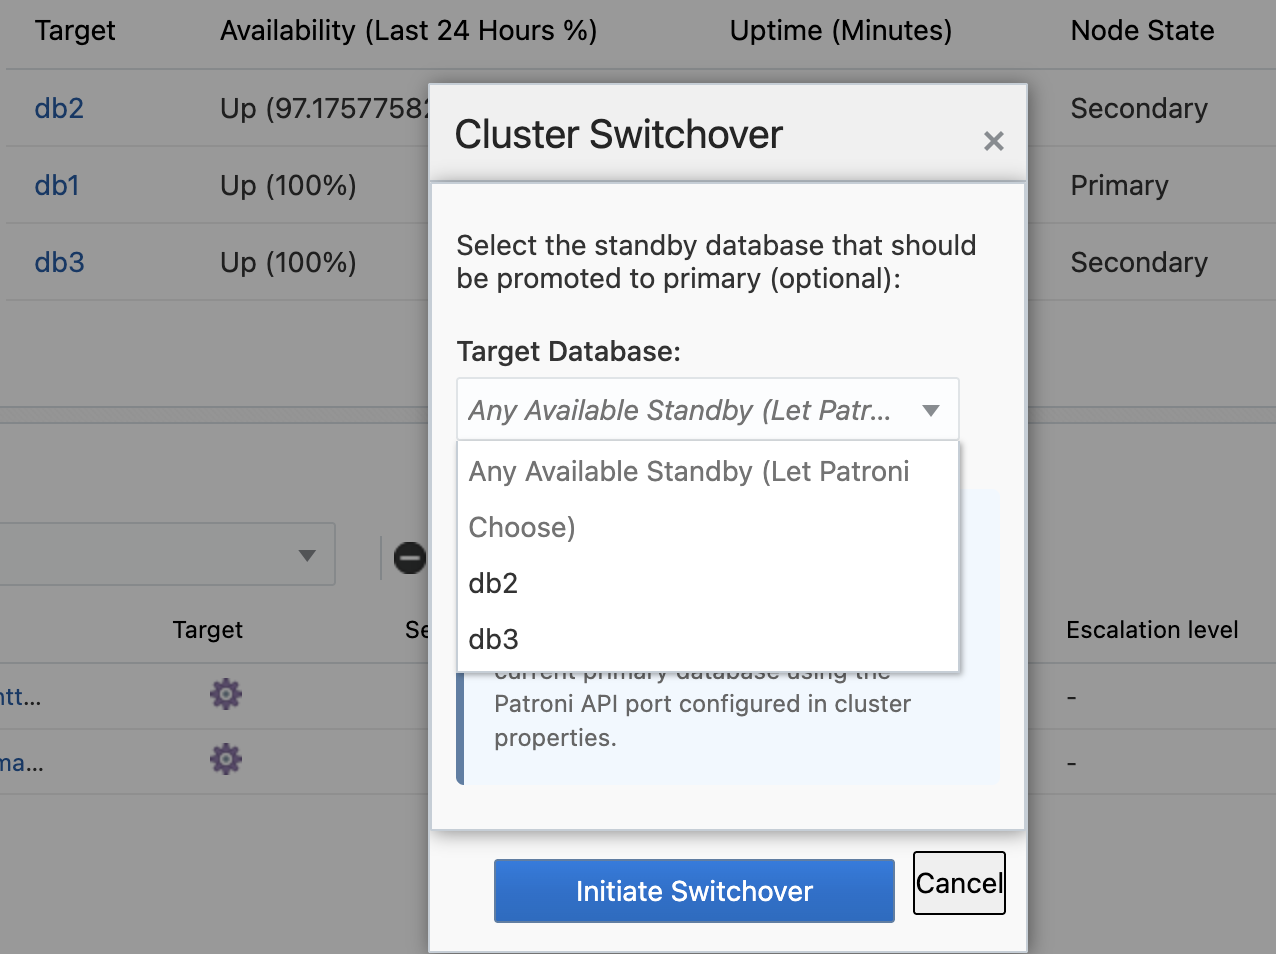
Confirming a switchover: promotes the selected standby, demotes the current primary.
Confirming submits an Enterprise Manager job that calls the Patroni REST API to promote the selected (or Patroni-chosen) standby and demote the current primary; the cluster is briefly unavailable during the operation. Track the job like any other from Enterprise Manager’s Job Activity.
Cluster Events (Patroni) metric
For Patroni-managed clusters with the Patroni API mode enabled, the plug-in also collects the cluster’s timeline-switch history as a standard metric, so “when did the cluster last change leaders?” is answerable from Enterprise Manager without a separate tool.
- On the cluster target, open All Metrics and select Cluster Events (Patroni).
- Each row is one timeline switch, with columns Timeline, Event Timestamp, New Leader, Reason, LSN, and Event Type.
- Collection runs hourly; standard Enterprise Manager metric-history views show the accumulated record.
The metric exists only on targets with Patroni REST API monitoring enabled; with it off there’s nothing to configure and no errors. If the Patroni REST API is unreachable, collection simply returns no rows for that cycle. How far back the history reaches depends on Patroni’s own retained history (max_timelines_history; Patroni’s default keeps everything). Event Type is currently always timeline_switch — Patroni’s history doesn’t reliably distinguish a planned switchover from an unplanned failover, so the plug-in doesn’t guess. This metric carries no alert thresholds; it’s a retrospective record, and leader-change alerting is handled by the cluster’s replication/failover monitoring.
Related
- Plan Drift Advisor — Query Analyzer’s drift link lands here, and the Fix Workbench is where a rewrite gets tested.
- Vacuum Advisor — owns Vacuums in Progress and Vacuum xmin Horizon.
- Workload History — wait-event sampling setup and the Wait Events chart, in depth.
- Targets and properties — the
Plugin Licenseproperty, Patroni REST API monitoring, and the rest of the target properties referenced on this page. - Jobs and metric extensions — the Kill Idle PostgreSQL Connections job and Switchover PostgreSQL Cluster job.