Monitoring Readiness
When an advisor page sits empty or a feature produces nothing, the cause is usually a missing prerequisite on the database rather than a fault in the plug-in. Monitoring Readiness checks each feature against the settings live on the target, shows the value currently in effect next to the value the feature needs, and applies the auto_explain settings for you where the plug-in can set them itself. Everything it does here is logging and parameter configuration: it never runs or EXPLAINs a query as part of configuration or collection.
Prerequisites for this page
- Viewing the page needs only the target’s monitoring connection. Readiness is probed by a real-time metric that runs under the monitoring role, so configuration you set up yourself is detected exactly like configuration the plug-in applied.
- The Configure auto_explain action runs as Enterprise Manager jobs, so Preferred Credentials must be set for the target.
- The server log read grant must be run by a superuser. The plug-in never applies it for you.
- Optional extensions are installed by you through your own platform packaging. The plug-in detects them automatically and never installs them.
Where to find it: on a PostgreSQL Database target, target navigation tree ▸ database name ▸ Monitoring Readiness. The same entry appears in the target menu.
In this page: The seven panels · Status model · Configure auto_explain · The grant the plug-in never applies · Query identifiers and the syn: fallback · Behaviors
The seven panels
The page probes once at load and renders seven panels, one per feature, in this order. Each panel carries a status chip; each item inside it carries a status dot, the value in effect on the server (“current: …”), the value the feature needs (“needs: …”), and a sentence explaining the consequence.
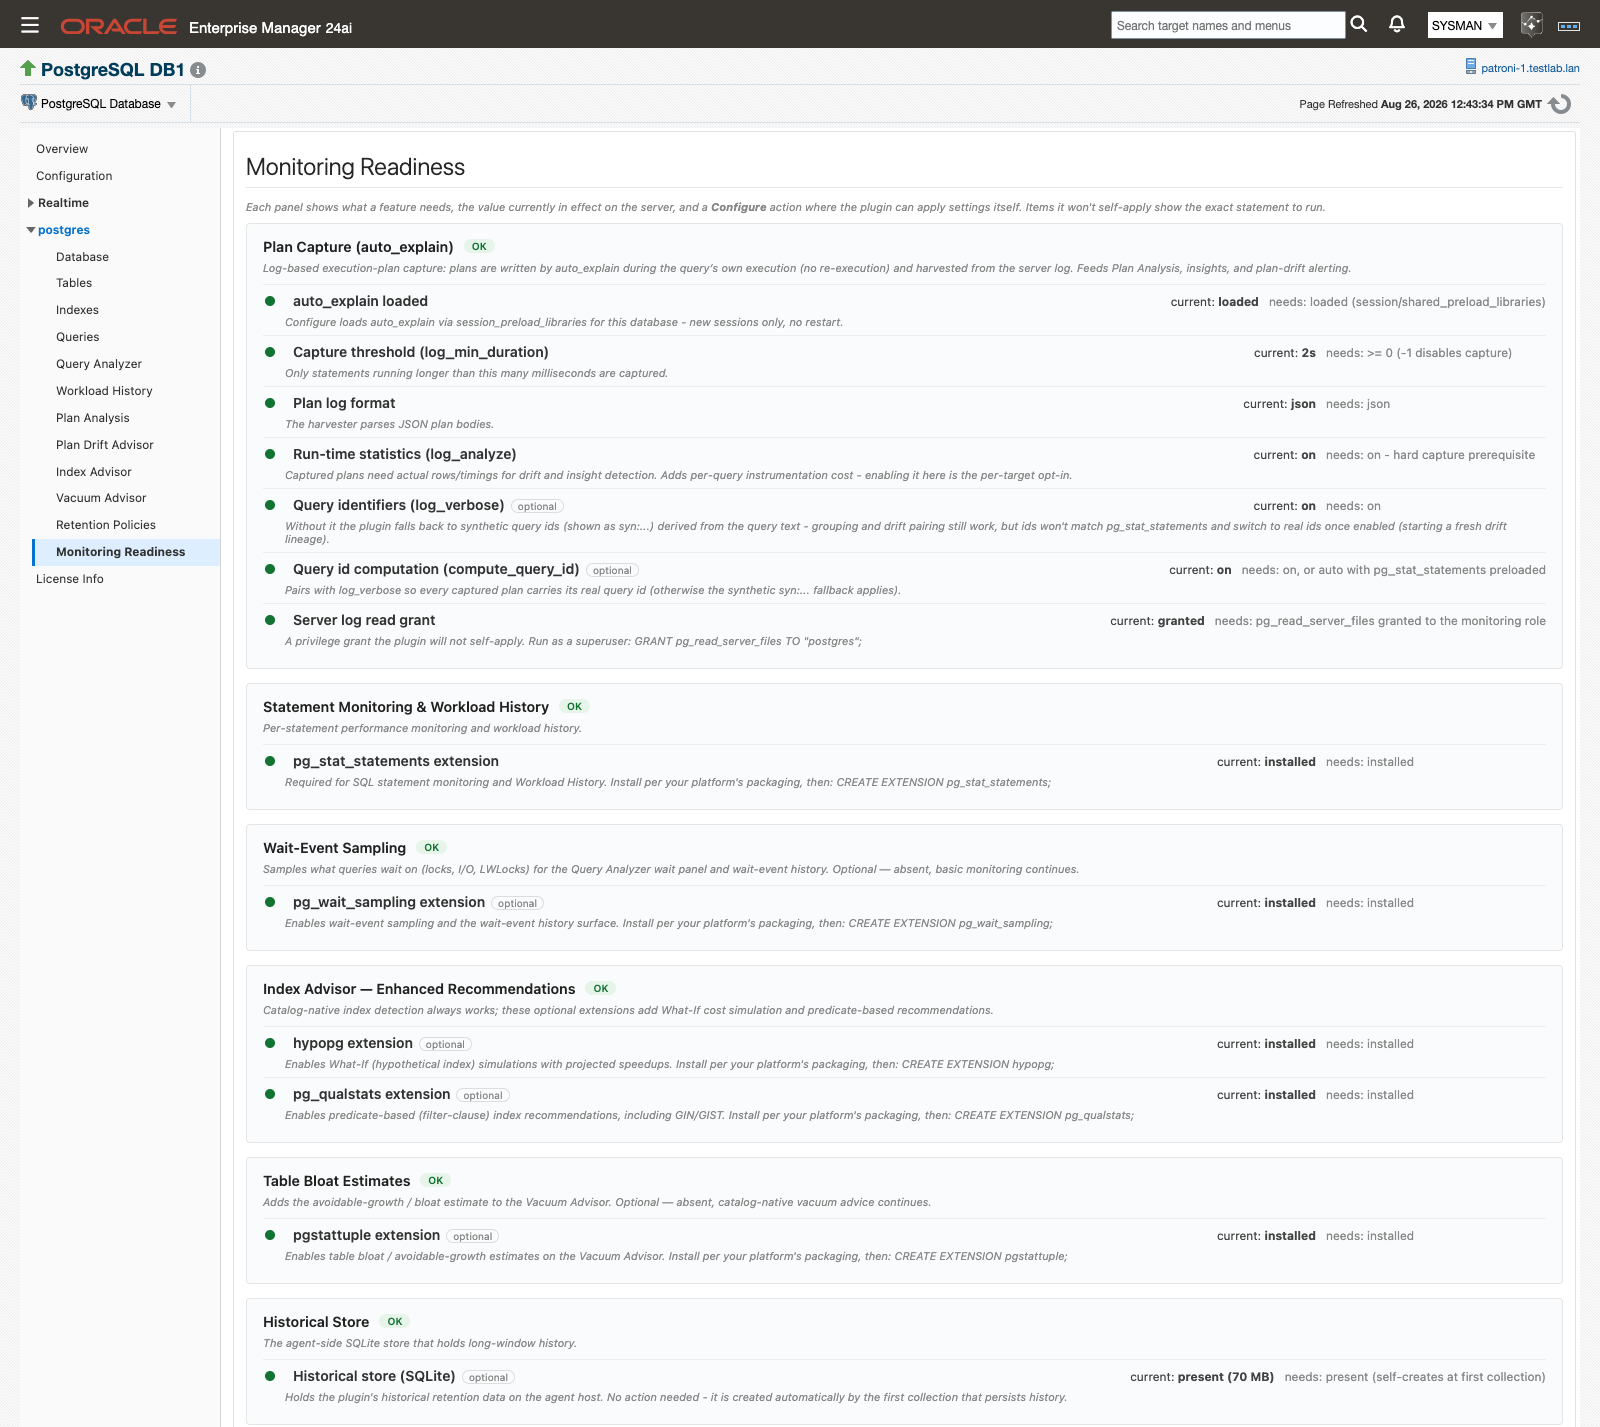
Seven panels, top to bottom: one per feature, each with its own status chip.
| Panel | What it checks | Required or optional |
|---|---|---|
| Database Connection | The monitoring connection every probe below depends on. | Required |
| Plan Capture (auto_explain) | The auto_explain settings and the log read grant behind log-based plan capture. |
Required for Plan Analysis and Plan Drift Advisor |
| Statement Monitoring & Workload History | The pg_stat_statements extension. |
Required for SQL statement monitoring and Workload History |
| Wait-Event Sampling | The pg_wait_sampling extension. |
Optional. Without it, basic monitoring continues. See Wait-event sampling |
| Index Advisor — Enhanced Recommendations | The hypopg and pg_qualstats extensions. |
Optional. Catalog-native index detection always works without them |
| Table Bloat Estimates | The pgstattuple extension. |
Optional. Adds bloat estimates to the Vacuum Advisor |
| Historical Store | The agent-side store that holds long-window history. | No action needed |
If Database Connection fails, the page reports that live readiness cannot be probed and asks you to verify the target is up and the monitoring credentials are valid. Until the connection succeeds, only Database Connection and Historical Store are shown — the feature panels are not probed at all.
Plans reach Plan Analysis by being written to the server log by auto_explain during the query’s own execution and harvested from there. No statement is re-executed to capture a plan.
Historical Store reports present (N MB), not created yet, or no store path configured. The store creates itself at the first collection that persists history, so “not created yet” on a new target is expected. See History store and retention.
Inside the Plan Capture (auto_explain) panel
This is the panel with the most items, and the only one the plug-in can configure for you.
| Item | needs: | Why it matters |
|---|---|---|
| auto_explain loaded | loaded (session/shared_preload_libraries) |
Configure loads auto_explain via session_preload_libraries for this database — new sessions only, no restart. |
| Capture threshold (log_min_duration) | >= 0 (-1 disables capture) |
Only statements running longer than this many milliseconds are captured. |
| Plan log format | json |
The harvester parses JSON plan bodies. |
| Run-time statistics (log_analyze) | on - hard capture prerequisite |
Captured plans need actual rows and timings for drift and insight detection. It adds per-query instrumentation cost, so enabling it is the per-target opt-in. |
| Query identifiers (log_verbose) — optional | on |
Without it, plans fall back to synthetic query ids. See Query identifiers and the syn: fallback. |
| Query id computation (compute_query_id) — optional | on, or auto with pg_stat_statements preloaded |
Pairs with log_verbose so every captured plan carries its real query id. |
| Server log read grants | EXECUTE on pg_current_logfile, pg_stat_file and pg_read_file in this database |
The harvester reads the server log file. See The grant the plug-in never applies. |
Status model
Every item shows a status dot and every panel a status chip, using three values.
| Status | Meaning |
|---|---|
| OK | The current value satisfies what the feature needs. |
| Attention | Something is unset, optional-and-absent, or the probe could not read the value — check the row before assuming the feature is fine. |
| Not functional | A mandatory item is unmet. The feature will not produce data until you fix it. |
A panel’s chip is the worst status among its items, with one deliberate exception: an item tagged “optional” never pushes a panel to Not functional. A missing optional extension shows Attention on its own row and caps its panel at Attention. So a Not functional chip always means a genuine blocker, but the reverse does not hold. A mandatory item the probe could not read also shows Attention, which is why an Attention chip on Plan Capture (auto_explain) still deserves a look at the rows underneath it.
Configure auto_explain
Configure auto_explain: preview, Apply, automatic re-probe.
When the Plan Capture (auto_explain) panel has at least one unmet item the plug-in can set itself, a Configure auto_explain button appears at the bottom of that panel, with the hint “Applies the plugin-settable items above to this database.” The button is hidden while everything settable is already green, because there is then nothing for it to do.
- Confirm that Preferred Credentials are set for the target. The apply runs as Enterprise Manager jobs; without them it fails with “Unable to run job. Verify Preferred Credentials are set for this target.”
- Click Configure auto_explain. An inline confirmation opens and previews exactly what will be written, under the heading “The following will be applied to this database (new sessions only, no restart):”
session_preload_libraries— ensureauto_explainis loadedauto_explain.log_min_duration = <N>(ms; the capture threshold)auto_explain.log_format = jsonauto_explain.log_analyze = on+log_timing = on(per-query instrumentation cost — this is the capture opt-in)auto_explain.log_verbose = on+compute_query_id = on(query identifiers)
- Read the threshold in the second line. The preview is read-only and writes back whatever is already in effect on the server, falling back to
1000ms whenauto_explain.log_min_durationis absent or set to-1; to capture at a different threshold, setauto_explain.log_min_durationon the server yourself and run Configure again. - Click Apply, or Cancel to close the confirmation without writing anything.
- Wait for the status line to read “Applied. Re-checking live settings… (new sessions pick the settings up)”. The page re-probes once on its own, the panel redraws with the new live values, and the button disappears when everything settable is green.
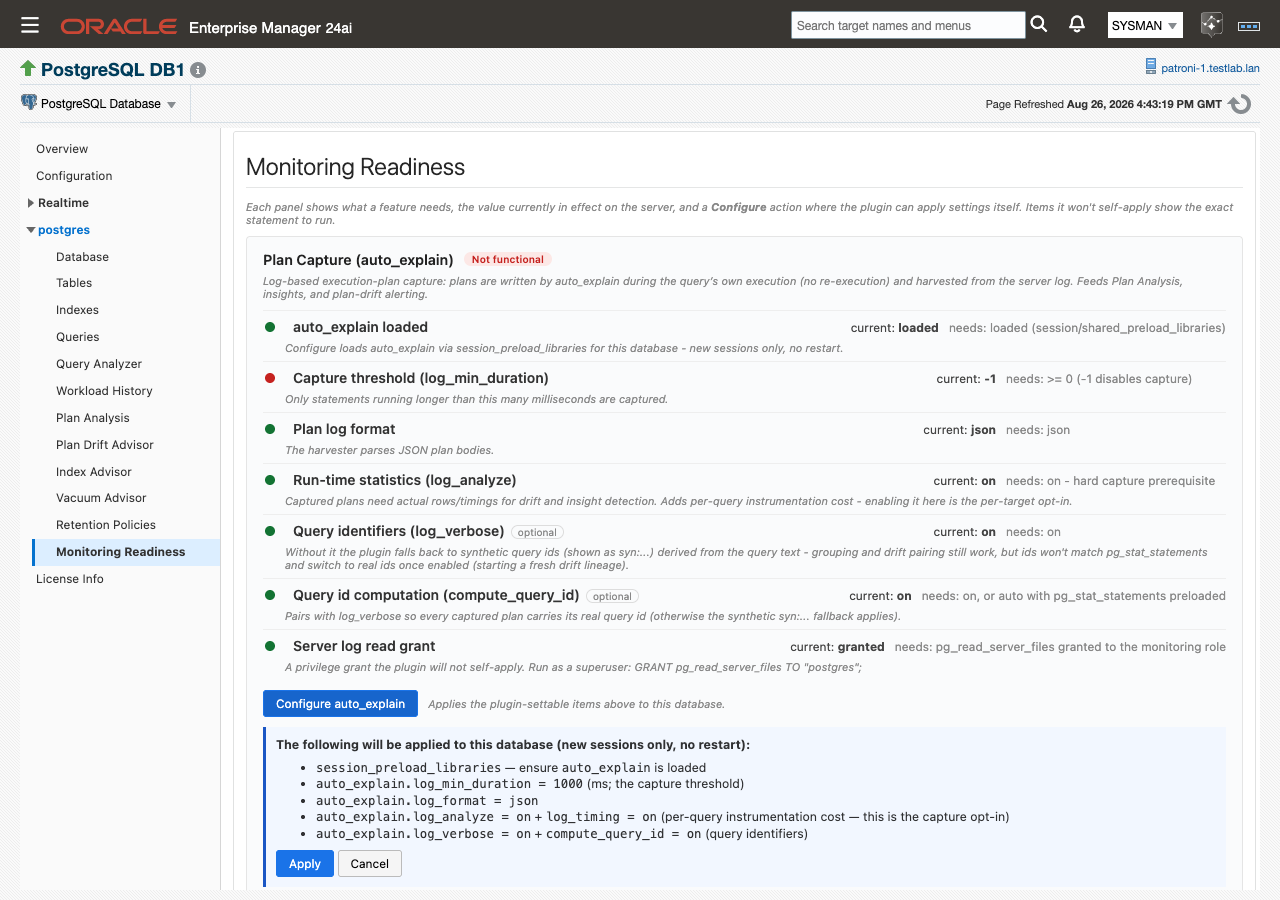
The confirmation previews every setting before anything is written.
Using Configure auto_explain is the per-target opt-in to log_analyze, which is why the preview names its instrumentation cost. Apply records that opt-in first, then applies the settings through the configuration job.
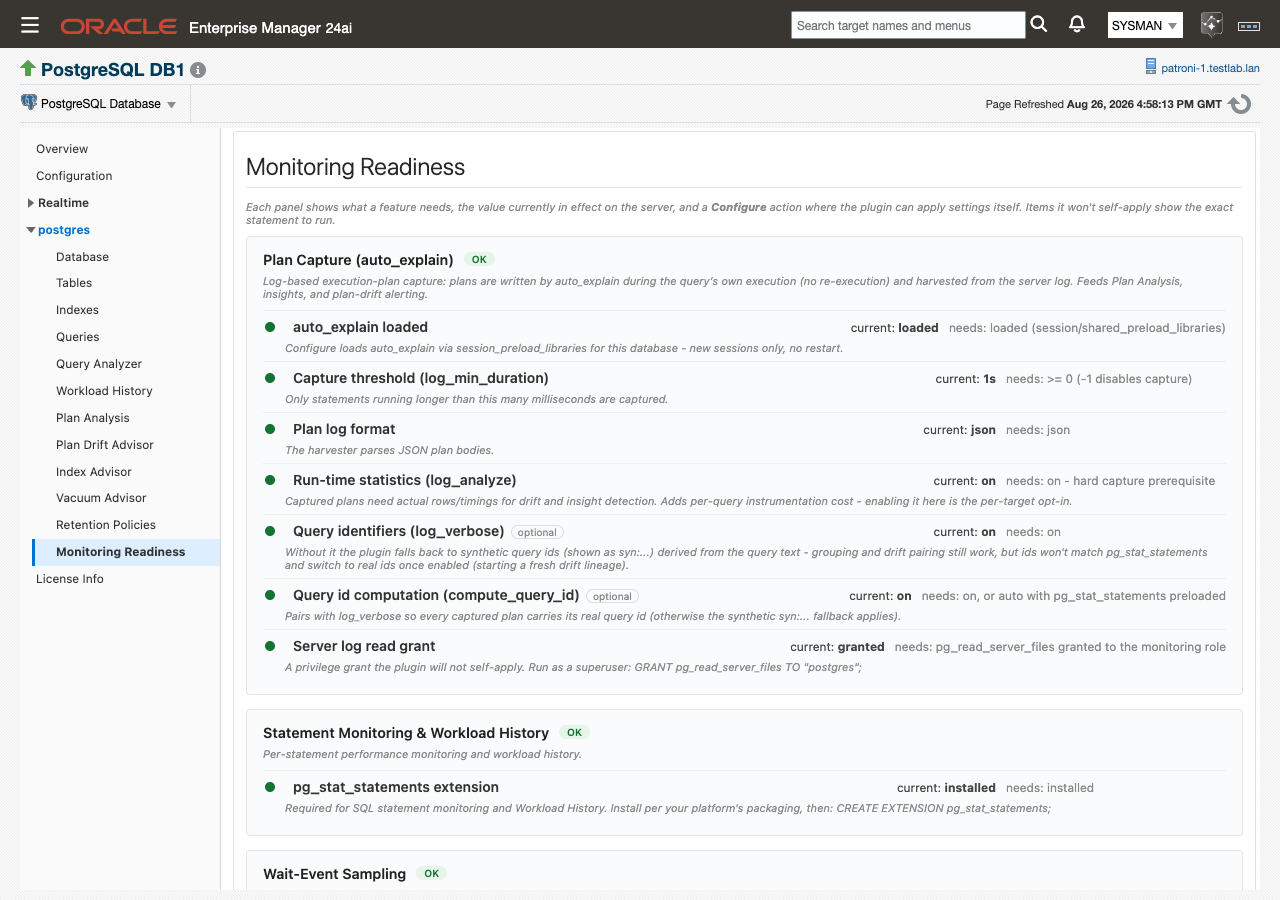
After the re-probe: every item the plug-in can set is OK, and the Configure button is gone.
For items the plug-in will not set itself (the log read grant and the extension installs), copy the statement from the item’s detail text, run it in your own tooling, and reload the page to see the verdict change.
The grant the plug-in never applies
One item is deliberately never self-applied: EXECUTE on the functions that read the server log. The plug-in reads the log to harvest plans, and granting itself the privilege to read server files is not a change it will make on your behalf.
The Server log read grants item shows the exact statement to run, with your actual monitoring role name and database already filled in, listing only the functions the role still lacks:
GRANT EXECUTE ON FUNCTION pg_current_logfile(), pg_current_logfile(text), pg_stat_file(text), pg_read_file(text, bigint, bigint) TO "<monitoring role>";
Run it as a superuser while connected to the database the target monitors (function privileges are per database), then reload the page. Until it is granted, the item reads missing: … and the Plan Capture (auto_explain) panel is Not functional — plans are written to the log but nothing can read them back. If the probe cannot determine the grants, the item reads undetermined and shows Attention. The Database Connection panel also carries a Monitoring role (pg_monitor) item: without pg_monitor several checks on this page cannot run.
Extension items behave the same way. Each shows an install hint of the form CREATE EXTENSION <name>;, and you install the underlying package through your own platform packaging first.
Query identifiers and the syn: fallback
Two items in the Plan Capture (auto_explain) panel are advisory rather than blocking: Query identifiers (log_verbose) and Query id computation (compute_query_id). Both show Attention when off, never Not functional.
When a captured plan arrives without a real query id, the plug-in computes a synthetic id of the form syn:<hex-hash> from the literal-normalized query text. Grouping, plan history, drift detection, and baselines all keep working on synthetic ids, and the syn: prefix makes them visible at a glance wherever query ids appear. What you lose is the join to pg_stat_statements: synthetic ids will not match the ids reported there.
The readiness row states the consequence directly: “Without it the plugin falls back to synthetic query ids (shown as syn:…) derived from the query text - grouping and drift pairing still work, but ids won’t match pg_stat_statements and switch to real ids once enabled (starting a fresh drift lineage).”
Enabling the two settings later is safe, but it has one side effect. Affected statements switch from syn: ids to real ids and start a fresh drift lineage, so their drift history restarts from that point. If you intend to enable them, enable them before you spend time accepting baselines. Both are included in the Configure auto_explain preview, so a single Apply covers them alongside the mandatory items.
Behaviors
No polling. The probe runs once at page load, plus one automatic re-probe after a Configure apply. Nothing refreshes in the background. If you change settings outside the console, reload the page to see the new verdict.
Units are read and converted. log_min_duration is reported by the server with its unit, for example 2s or 500ms. The page shows the value as the server reports it and converts it correctly when building the Configure preview, so a server set to 2s appears in the preview as 2000 ms.
New sessions only. Applied settings take effect for new sessions and need no restart. Long-lived application sessions keep their old settings until they reconnect, so capture from a connection-pooled application may not begin until the pool recycles.
Pre-existing configuration counts. Because readiness is probed under the monitoring connection rather than reconstructed from what the plug-in has written, a database you configured yourself shows green exactly like one configured from this page.
Related
- Prerequisites — the full setup list behind every panel here, including the monitoring role and optional extensions
- Plan Analysis — what plan capture feeds once this page is green
- History store and retention — the store behind the Historical Store panel
- Troubleshooting — what to do about “Unable to run job. Verify Preferred Credentials are set for this target.”