Alerts and thresholds
The plug-in ships curated WARNING and CRITICAL thresholds. They are enabled the moment a target is created — there is nothing to import and nothing to switch on — and every one of them is editable per target in the Enterprise Manager console.
Prerequisites for this page
- A target that is collecting. Thresholds are live from the moment the target exists, but they cannot fire on a metric that has never collected.
- Enterprise Manager access to Metric and Collection Settings, to change any of them.
In this page: What ships enabled · The thresholds · Changing a threshold · Applying settings across many targets · Why some thresholds have only a critical value
What ships enabled
Fourteen thresholds ship with the plug-in, spread across availability, space, performance, backup, high availability and licensing. They are defaults, not recommendations for your estate: they are set where a value is unambiguously worth waking someone for, and they are deliberately conservative so a new target does not flood you on day one.
The plug-in does not ship an Enterprise Manager Monitoring Template. A template is a separate artifact that an administrator applies across many targets at once, usually with different values for production, test and development. If you want that, you build it from these defaults — see Applying settings across many targets below.
The thresholds
| What it watches | Metric column | Warning | Critical | Fires when |
|---|---|---|---|---|
| Instance availability | Response Status |
— | 1 | The instance is down |
| Database free space | DbFreespace free_pct |
15 | 5 | Free space falls below the percentage |
| Host CPU | Processor cpu_utilization_pct |
80 | 90 | CPU utilisation exceeds the percentage |
| AG replica link | AgFailoverReadiness link_healthy |
— | 1 | The replica link is broken |
| AG redo queue | AgFailoverReadiness redo_queue_kb |
1048576 | 5242880 | The redo queue exceeds the size in KB |
| AG send queue | AgFailoverReadiness log_send_queue_kb |
1048576 | 5242880 | The send queue exceeds the size in KB |
| AG recovery point | AgFailoverReadiness rpo_seconds |
300 | 900 | The recovery point exceeds the seconds |
| Backup age | LastDatabaseBackup hours_since_last_backup |
48 | 168 | No backup within the hours |
| Transaction log | TransactionLog log_space_used_pct |
75 | 90 | Log space used exceeds the percentage |
| Licence | License days_remaining |
30 | 7 | Fewer days remain on the licence |
| Deadlocks | DeadlockRate deadlocks_last_hour |
5 | 20 | Deadlocks in the trailing hour exceed the count |
| Blocking | BlockedSessions blocked_sessions |
5 | 20 | Blocked requests exceed the count |
| Connection saturation | ConnectionSaturation connection_saturation_pct |
80 | 90 | User connections exceed the percentage of the cap |
| TempDB contention | TempdbContention pagelatch_ex_waiters |
5 | 20 | Exclusive page-latch waiters exceed the count |
The License row watches days_remaining, but the metric also carries a Status column — Active, License Required, Invalid Signature, Wrong Product, Expired or Exceeded Limit — and raises its own CRITICAL incident whenever that status is anything but Active, independently of the days-remaining threshold above. See the Open Beta notice for what each status means and what to do about it.
For metrics measured as a snapshot rather than a rate, use Enterprise Manager’s per-threshold number of occurrences setting to require a condition to persist before it raises an incident. A single sample of high blocking is often noise; the same value across three consecutive collections is not.
Changing a threshold
From the target’s menu, choose Monitoring then Metric and Collection Settings. Every threshold above appears there with its shipped value, and any change applies to that target only.
When a threshold is crossed, the incident appears in Enterprise Manager and on the target’s own Overview page:
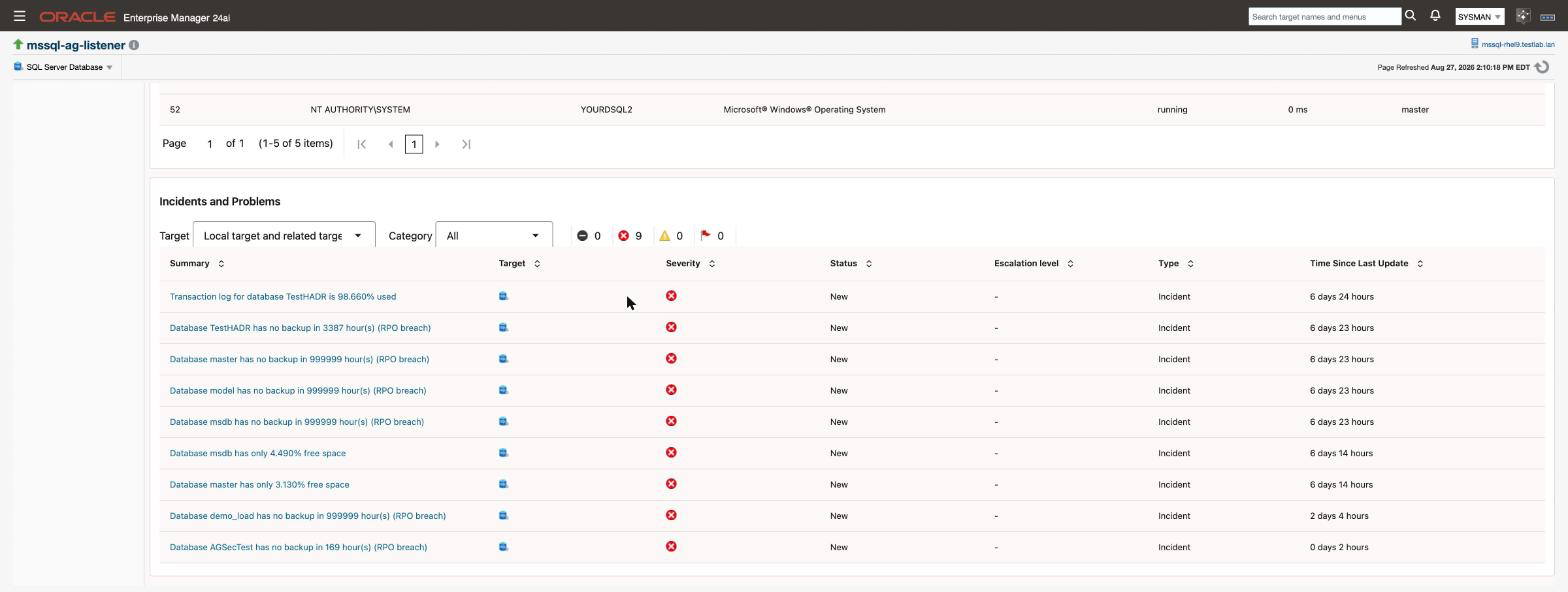
Collection intervals are set in the same place. They range from one minute for instance availability to 24 hours for server configuration and per-database space, so a metric you have just changed may not reflect it until its next collection.
Applying settings across many targets
Because the plug-in ships defaults rather than a template, estate-wide tuning is done with Enterprise Manager’s own template mechanism:
- Tune one target until its thresholds match your standard.
- From Enterprise → Monitoring → Monitoring Templates, create a template from that target.
- Apply the template to the targets or target group you want it on.
This keeps the plug-in’s defaults as a sane starting point while letting you hold production and development to different standards.
Why some thresholds have only a critical value
Two of the fourteen, instance availability and the AG replica link, have a critical value and no warning. That is deliberate: they are binary conditions. An instance is up or down; a replica link is healthy or broken. There is no middle state worth a lower severity, and inventing one would only produce an alert nobody can act on differently.
The AG replica link threshold is also deliberately not placed on the readiness column. A healthy asynchronous-commit disaster-recovery secondary sits permanently in a synchronising state, so alerting on readiness would raise a standing critical on a perfectly correct topology. Replication lag is covered instead by the redo queue, send queue and recovery-point thresholds above, which measure how far behind the replica actually is.
Related
- Monitoring pages - the data the thresholds are evaluated against
- Monitoring pages - collection intervals, set in the same place as thresholds
- High availability - why the AG critical sits on the replica link
- Compliance rules - configuration findings, which alert differently
- Troubleshooting - a threshold that never fires
- Open Beta notice - what each
Licensestatus means