Monitoring pages
The plug-in adds seven native console pages to the target’s menu: Home (the target’s home page), Analysis, Performance, Storage, Backup History, SQL Analytics and HADR. Each page reads the metric groups the plug-in already collects. Nothing on a page writes to the database, except the Kill Blocking Application button on Analysis, which submits a job.
Prerequisites for this page
- A target added and collecting — see Targets and properties.
- The License metric reporting
Active, or every page below stays nearly empty — see Troubleshooting.- The Kill Blocking Application action on Analysis needs the target’s IBM DB2 Database Host Credentials set, and an agent on the Db2 host — see Jobs.
Where to find it: the IBM DB2 Database target’s navigation tree — the seven pages at the top level; the full metric detail under Monitoring → All Metrics.
In this page: Time windows and refresh · Home · Analysis · Performance · Storage · Backup History · SQL Analytics · HADR · Everything else
Time windows and refresh
A region marked real time asks the agent to run its metric group’s collection again on every refresh — once a minute while the page is open — in addition to the normal schedule. That is what makes the values live, and it is also load on the database, so each page asks only for what it shows. A real-time chart starts empty when you open the page and fills in as samples arrive; for history, pick a window that reads stored data. Every window selector uses the same labels, and says under it what the chosen window means. The Trend windows on Storage, Backup History and HADR read stored data only, so a trend chart never adds a collection.
| Page | Time window | Refresh |
|---|---|---|
| Home | Live, no selector. The Health Overview reads Enterprise Manager’s current alerts | 60 s |
| Analysis | Live, no selector: locks being waited on right now | 60 s |
| Performance | Selector: Real time (live) (default), Latest collection, Past hour, Past day, Past week (aggregated), Past month (aggregated). It moves every region on the page | 60 s in real time |
| Storage | Tables and bars live. Trend selector at the bottom: Past hour, Past day (default), Past week (aggregated), Past month (aggregated) | 60 s |
| Backup History | Tables live. Trend selector, as Storage | 60 s |
| SQL Analytics | One window for the whole page: Past hour, Past day (default), Past week (aggregated), Past month (aggregated). There is no real time, because a live read would disturb the per-interval deltas | On window change |
| HADR | Tables and bars live. Trend selector below the bars, as Storage; incidents at the bottom | 60 s |
Home
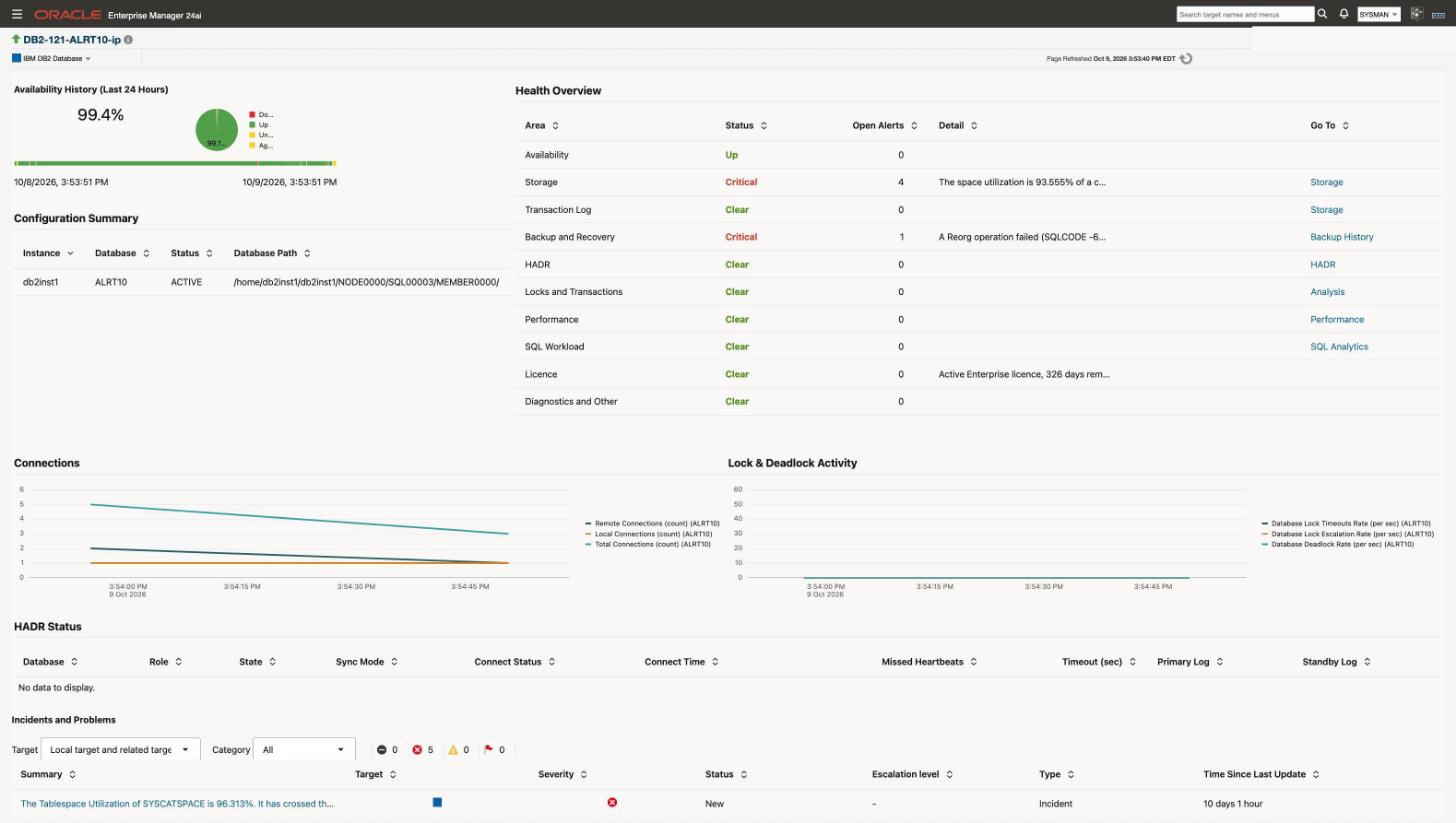
Home is the target’s landing page — open it first to see whether a database is healthy at a glance.
- Availability — the last 24 hours, and a 7-day timeline.
- Configuration Summary — instance, database, status, database path, capacity and current size (in KiB, MiB or GiB), and current connections.
- Health Overview — one row per area: Availability, Storage, Transaction Log, Backup and Recovery, HADR, Locks and Transactions, Performance, SQL Workload, Licence, and Diagnostics and Other. Each row shows Enterprise Manager’s own current verdict, the number of open alerts, the worst alert’s message, and a Go To link to the page that shows the metric behind it. The verdicts come from Enterprise Manager’s current alerts and availability, so a threshold you tune changes the overview too; the page recomputes nothing. A metric group that is failing to collect counts as a warning under Diagnostics.
- Connections — remote, local and total application connections (live chart).
- Lock & Deadlock Activity — lock-timeout, lock-escalation and deadlock rates (live chart).
- HADR Status — role, state, sync mode, connect status and time, missed heartbeats, timeout, and the primary and standby log positions, when the database is in an HADR pair. See HADR monitoring.
- Related Targets — the targets Enterprise Manager associates with this database, with their type and status: the Db2 server it runs on, its HADR standby (or, on a standby, its primary), the monitoring agent, and the agent’s host. An HADR standby that does not accept connections has no “runs on” row, because Enterprise Manager forms that association from configuration the standby cannot report.
- Incidents and Problems — Enterprise Manager’s own incident region for the target.
Analysis
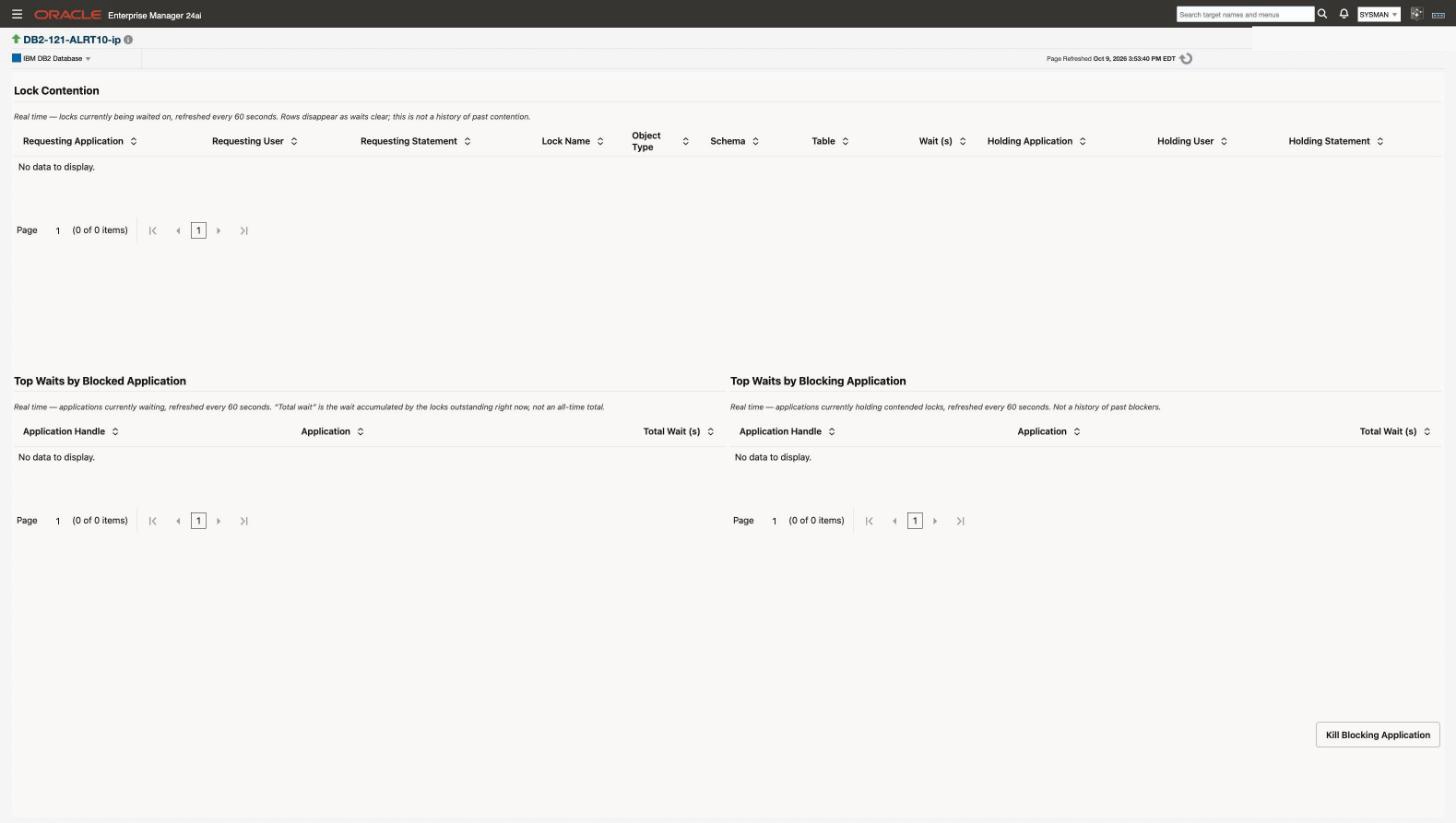
Analysis is where you chase lock contention. Its lock regions are live: they show locks being waited on now, and rows disappear as waits clear. They are not a history of past contention — for that, use the lock alerts and the Applications Blocked on Locks runbook (Alerts and thresholds).
- Lock Contention — each live lock wait: the requesting application, user and statement; the lock name and object type; the locked schema and table; how long it has waited; and the holding application, user and statement.
- Top Waits by Blocked Application — the applications waiting longest. This table has no kill action on purpose: forcing off a waiting application leaves the lock holder, which causes the contention, in place.
- Top Waits by Blocking Application — the applications holding locks others wait on, with the Kill Blocking Application button:
- Select a row and click the button. A confirmation names the application handle and the application.
- Only Yes submits the Kill IBM Db2 Application job (Jobs).
- The page reports that the job was submitted and, when it finishes, whether Db2 forced the application off. Otherwise it shows Db2’s message, for example
SQL1230Wwhen the application has already gone.
The job is local-only: on a target monitored by an agent that is not on the Db2 host, the button’s result is the job’s refusal message. To force an application on a remotely monitored target, use the remote Force Application job instead (Remote admin jobs).
- Job Activity — Enterprise Manager’s count of this target’s job executions over the last 7 days by status, so a kill submitted from this page shows up here.
- Incidents and Problems — the target’s open incidents, including the lock alerts.
An empty Lock Contention table is a healthy, uncontended database, not a collection failure.
Performance
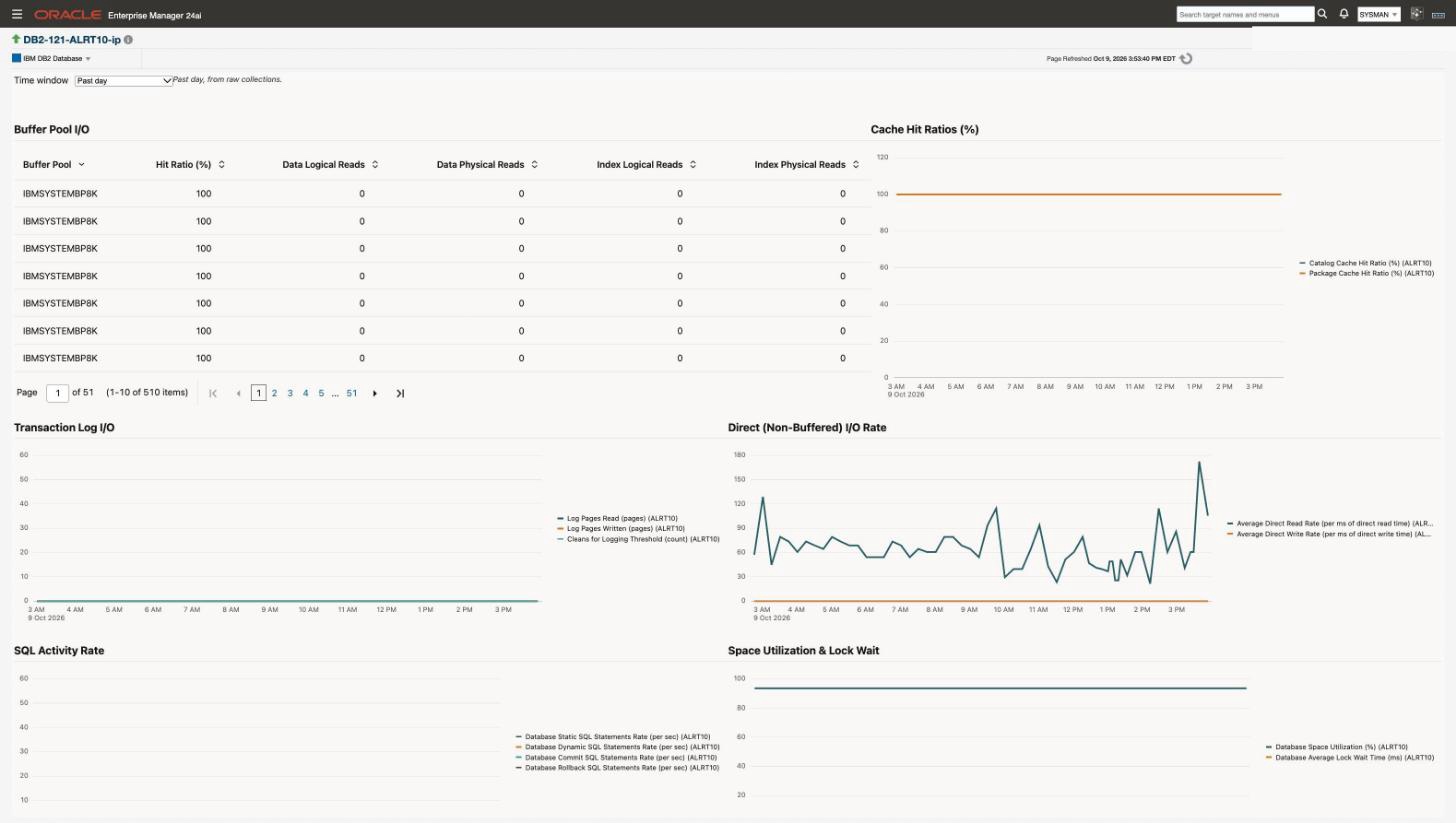
Performance is where the buffer pool, cache, and I/O detail lives. The Time window selector at the top moves every region at once. Real time (live), the default, has no fixed span: it starts empty and fills in, one point a minute, for as long as the page is open. Past week (aggregated) and Past month (aggregated) read Enterprise Manager’s hourly aggregates, because raw data is kept for about 7 days, so short peaks show lower.
- Buffer Pool I/O — per buffer pool, the hit ratio and logical and physical data and index reads. On a past window the table lists one row per buffer pool per collection.
- Cache Hit Ratios (%) — catalog- and package-cache hit ratios, with a table of the lookup counts underneath, so an idle cache (few lookups, ratio held at 100%) can be told apart from a genuinely perfect one.
- Transaction Log I/O — log pages read and written, and cleaners triggered by the log threshold.
- Direct (Non-Buffered) I/O Rate — average direct read and write times.
- SQL Activity Rate — static, dynamic, commit and rollback statement rates.
- Space Utilization & Lock Wait — database space utilization and average lock-wait time.
Storage
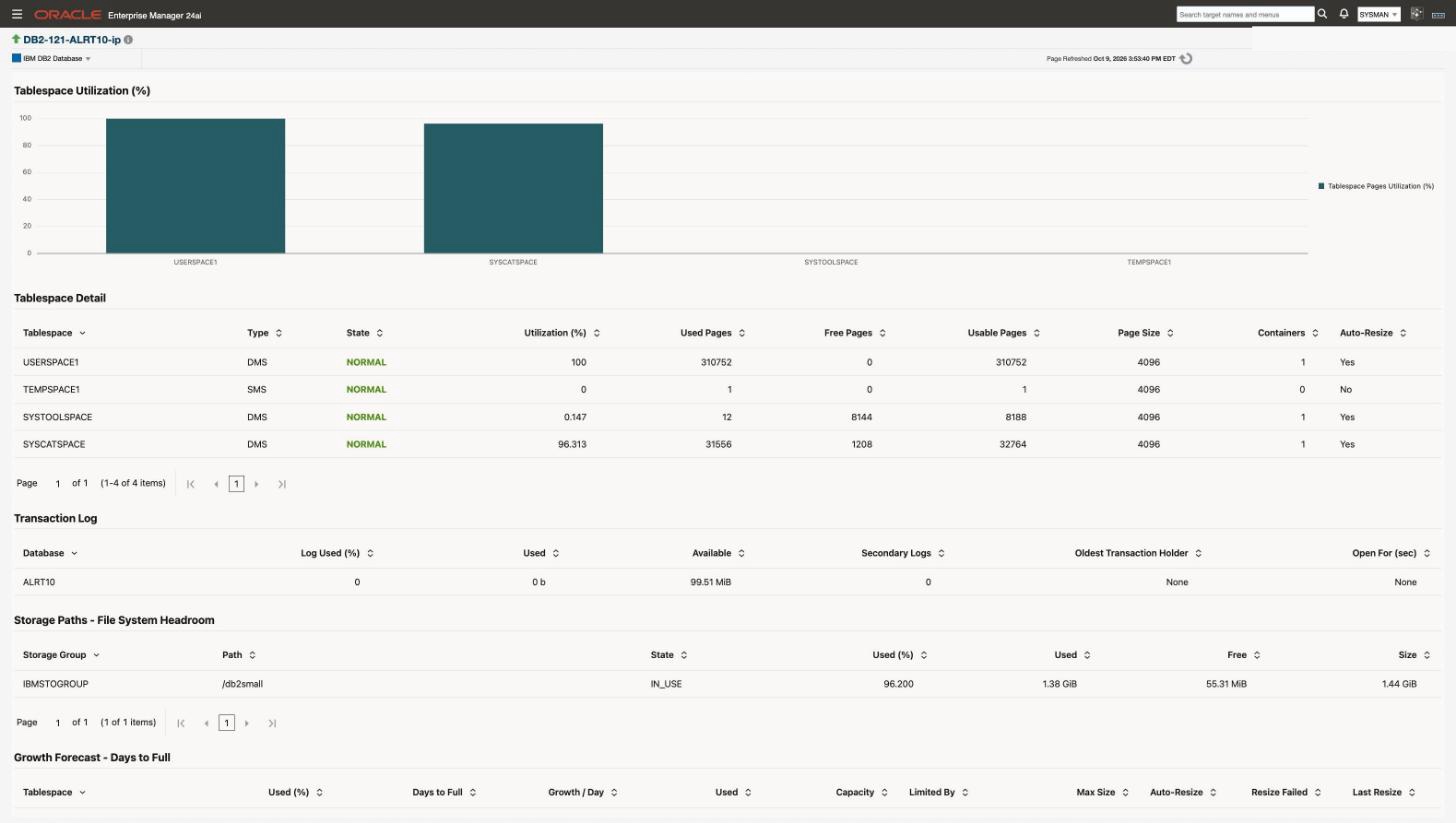
- Tablespace Utilization (%) — one bar per tablespace.
- Tablespace Detail — type, state, utilization, used, free and usable pages, page size, number of containers, and auto-resize.
- Transaction Log — log used (%), which the transaction-log alert fires on; used and available space; secondary logs in use; and the oldest transaction holding the log, with how long it has been open.
- Storage Paths - File System Headroom — each automatic-storage path with its file system’s free space.
- Trend — database space utilization (%) and transaction log used (%) over the chosen window.
- Growth Forecast - Days to Full — per tablespace: used (%), projected days to full, growth per day, used space and capacity, what limits it (Limited By: MAXSIZE, the file system, or fixed containers), maximum size, auto-resize, whether a resize failed, and the last resize. A fresh target reads
9999(no forecast) until there is enough history to fit a trend, and so does a target just after a plug-in upgrade.
Backup History
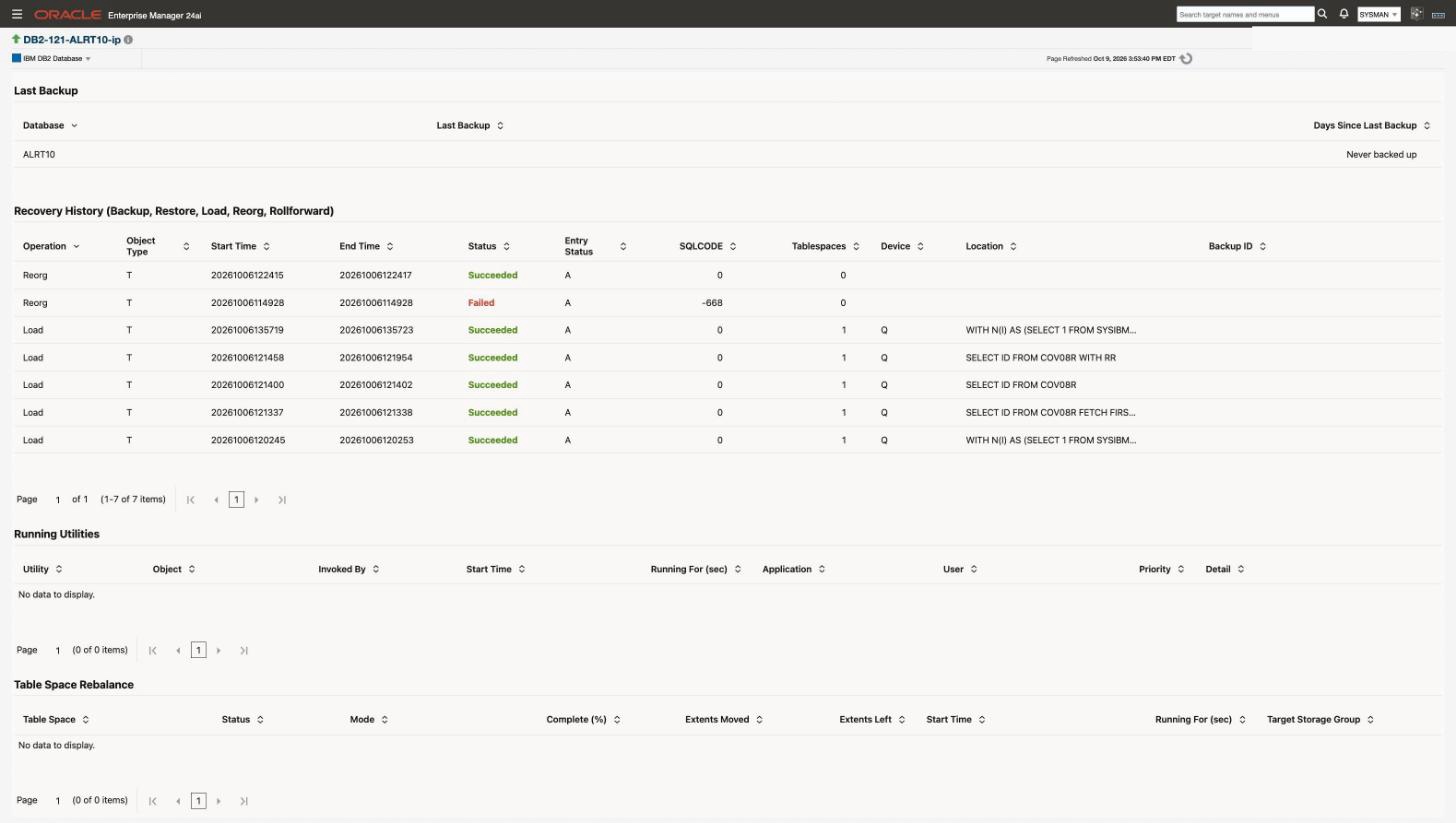
- Last Backup — when the last successful backup ran and the days since, which is what the backup-age alert fires on; or Never backed up.
- Recovery History (Backup, Restore, Load, Reorg, Rollforward) — Db2’s recovery history with each operation’s object type, start and end, status (failures in red with their SQLCODE), tablespaces, device, location and backup ID.
- Running Utilities — utilities in progress now (backup, load, reorg, runstats and others): the object, who invoked it, when it started and how long it has run, the application and user, priority and detail.
- Trend — days since the last backup over the chosen window, so a schedule that slipped shows as a rising line (-1 means never backed up).
- Table Space Rebalance — rebalance operations after storage changes: status, mode, percent complete, extents moved and left, start time, how long they have run, and the target storage group.
SQL Analytics
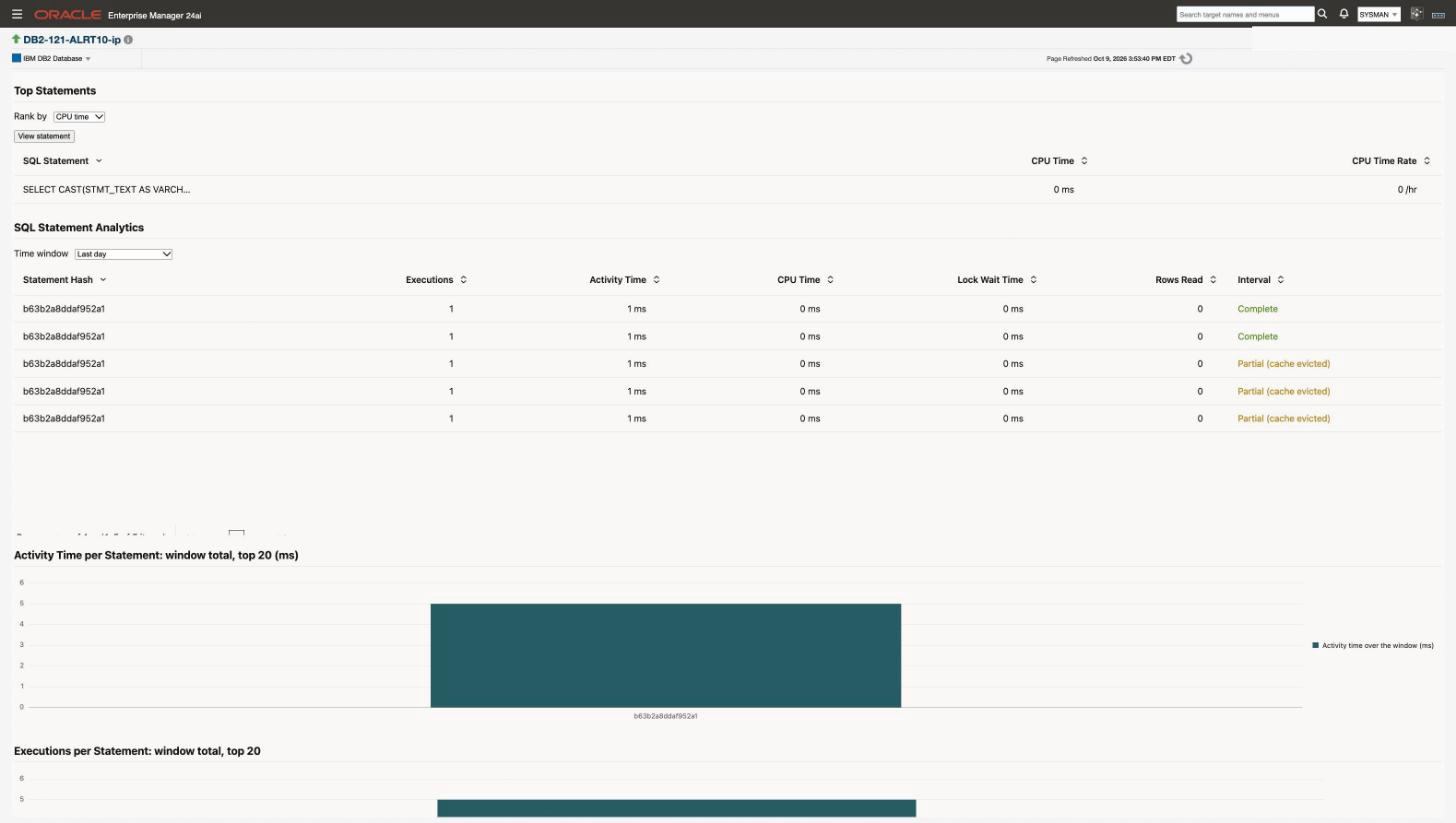
- Time window (top of the page) — Past hour, Past day (default), Past week (aggregated) or Past month (aggregated). Every section below follows it.
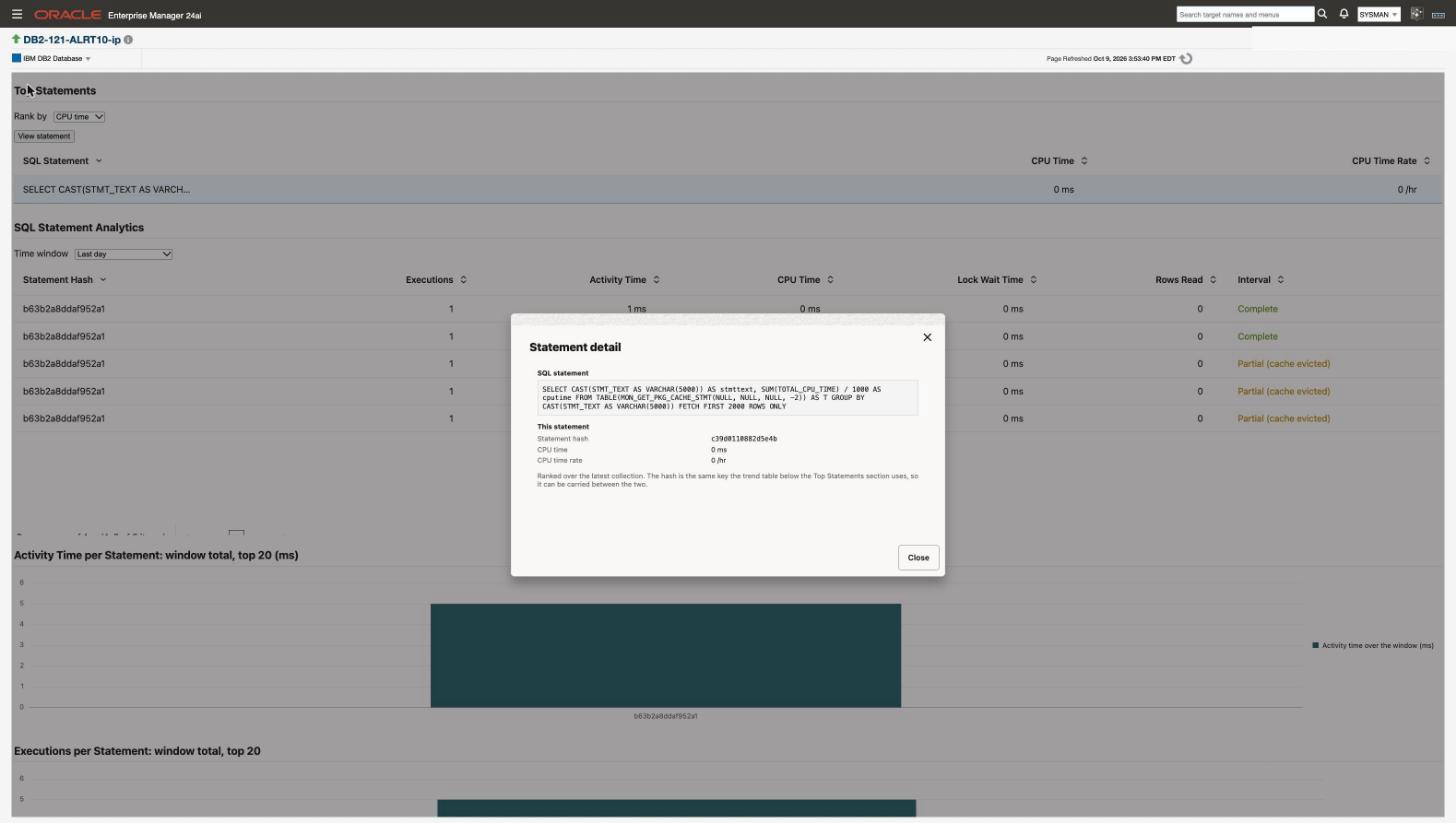
- Top Statements — the 20 statements with the most CPU time or the most Executions in the window (the Rank by selector), with their SQL text, executions, CPU time, CPU per execution, activity time and rows read. Click a statement, or press Enter on it, to open the statement detail: the SQL text, the statement hash, and its CPU time and executions over the window.
- The text comes from the SQL Statement Text metric group, which stores each statement’s text once a day, flattened to one line and cut at 2,000 characters. Statement text can contain literal values from your data — read Statement text and your data, which also shows how to turn its collection off.
- Known issue: after one failed text lookup, Top Statements keeps showing numbers without SQL text until you change the time window or the ranking. Refreshing the page does not retry the lookup; the ranking and numbers stay correct. Fixed in the first update after GA.
- SQL Statement Analytics — per statement over the window: executions, activity time, CPU time, lock-wait time and rows read, with each interval marked Complete or Partial (cache evicted) when the statement left Db2’s package cache during the interval and its numbers undercount.
- Activity Time per Statement and Executions per Statement — the top 20 statements of the window as bars.
The statement hash is the same key the SQL Statement Analytics table uses, so a statement can be followed from one table to the other.
HADR
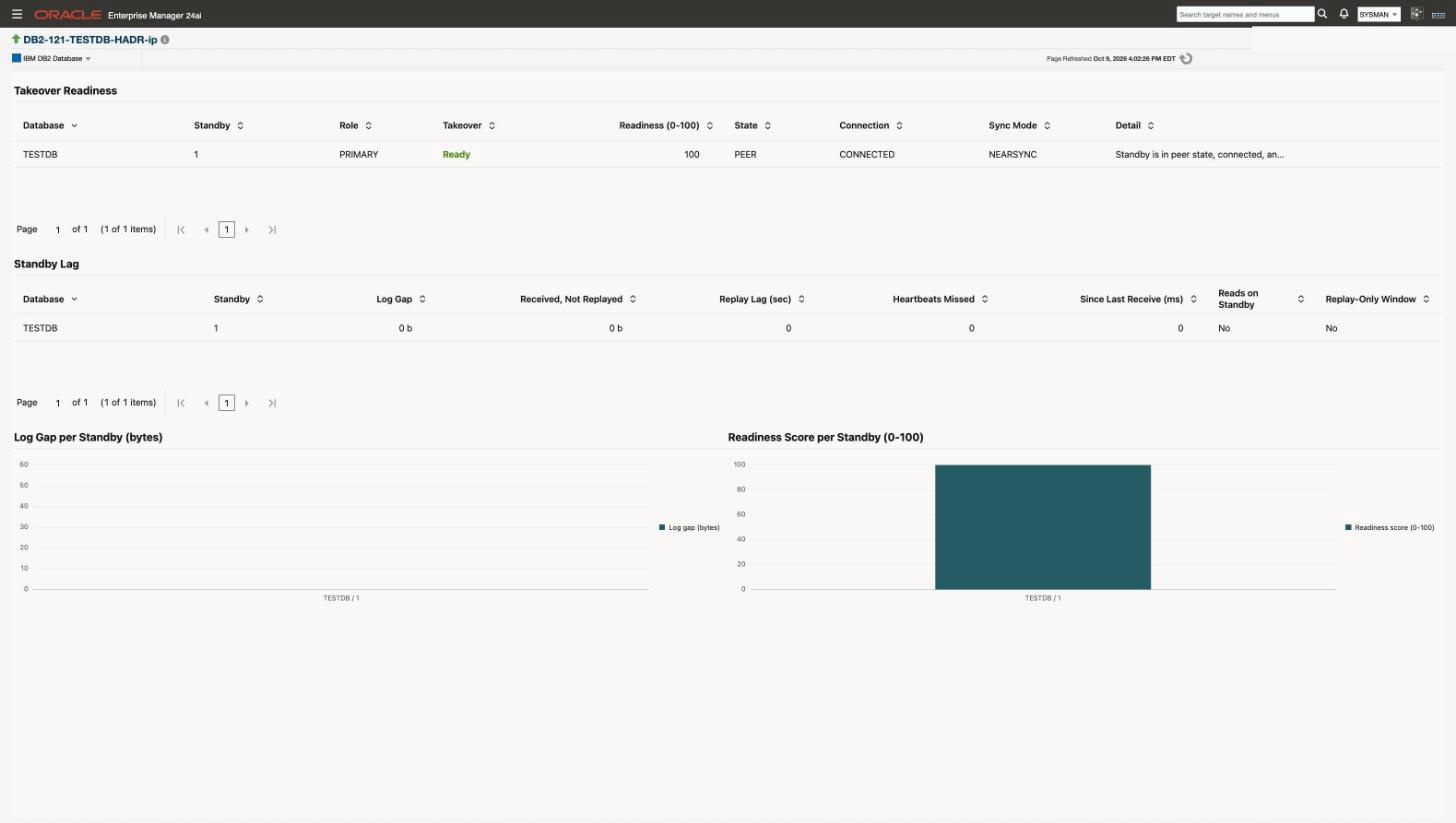
The page is meant for an HADR primary or standby; on a database with no HADR it shows no rows.
- Takeover Readiness — per standby: the role, whether it could take over now (Ready or not), a readiness score (0–100), the HADR state, connection and sync mode, and the reason in plain words.
- Standby Lag — per standby: the log gap, log received but not yet replayed, replay lag, missed heartbeats, time since the last receive, and whether reads on standby and the replay-only window are on.
- Log Gap per Standby (bytes) and Readiness Score per Standby (0-100) — bars, one per standby, live.
- Trend — log gap and replay lag per standby over the chosen window.
- Incidents and Problems — the target’s open incidents, including the HADR alerts.
See HADR monitoring for the metric groups behind the page, monitoring a standby as its own target, and following the primary through a takeover.
Everything else
Every metric group, including the ones no page shows in full, is under the target’s Monitoring → All Metrics: pick the group by name. CollectorStatus is the one to read when a group is empty — it says, per group, whether it is collecting, not configured, not collected yet, gated off, or failing. See Troubleshooting and, for the shipped thresholds, Alerts and thresholds.
Related
- HADR monitoring — the full HADR column set, the takeover-readiness composite, and log-gap trending
- Jobs — the Kill IBM Db2 Application job behind the Analysis page’s button, and the remote jobs
- Alerts and thresholds — the default Warning/Critical thresholds shipped on these metric groups
- Troubleshooting — why a page can stay empty on an Up target